...
| Info |
|---|
The following step-by-step instructions and screenshots are based on the Windows 7 10 operating system with the Windows Classic desktop theme and ArcGIS Pro 3.2.1.3 0 software. If your personal system configuration varies, you may experience minor differences from the instructions and screenshots. |
...
If you are completing this tutorial from a public computer in Fondren Library and are logged on using the gistrain profile, follow the instructions below:
- On the Desktop, double-click the Computer icon > File Explorer icon > This PC > gisdata (\\file-rnas.rice.edu) (R:) > Short_Courses > Map_Layouts_for_Publication
- To create a personal copy of the tutorial data, drag the Layouts folder onto the Desktop.
- Close all windows.
...
- On the Desktop, double-click the Layouts folder.
- Double-click the Layouts.aprx project project file to open the project in ArcGIS Pro.
...
Establishing a Map
...
- In the Map ribbon, in the Layer group, click Basemap and select Light Gray Canvas.
- In the Contents pane, uncheck the World Light Gray Reference layer to toggle it off.
- In the Catalog pane, in the Databases folder, expand the Layouts.gdb geodatabase.
- Right-click the BlockGroupCensusData feature class and select "Add to Current Map."


Editing Class Boundaries
...
- In the Contents pane, right-click BlockGroupCensusData and select Symbology.
- In the new Symbology pane to the right, click the Primary Symbology drop-down menu and select Graduated Colors.
- In the Field drop-down menu, select the MEDIAN_HOUSE_INCOME field.
- In the Classes drop-down menu, select 4.
...
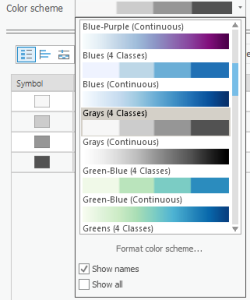
- Click the Color scheme drop-down menu.
- At the bottom of the menu, select check "Show names."
- Scroll down the Color scheme menu and select Grays (4 Classes).
...
| Note |
|---|
The Label text reverts to default every time the Upper value for the cell changes. Therefore, change all the Upper values for your data before customizing the Label. |
- Click the Label cell for the first class that reads "≤50000" and type "$0 - $50,000." Press Enter.
- Click the Label cell for the second class that reads "≤90000" and type "$50,001 - $90,000." Press Enter.
- Click the Label cell for the third class that reads "≤150000" and type "$90,001 - $150,000." Press Enter.
- Click the Label cell for the fourth class that reads "≤250001" and type "$150,001 - $250,001." Press Enter.

...
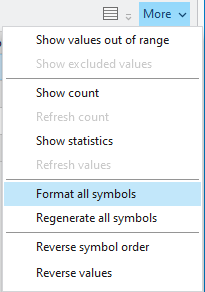
- Click the More drop-down menu to the top right of the Upper value table.
- Under Symbols, click Click Format all symbols.

- At the top of the pane, note how Gallery is selected by default. Select Properties.
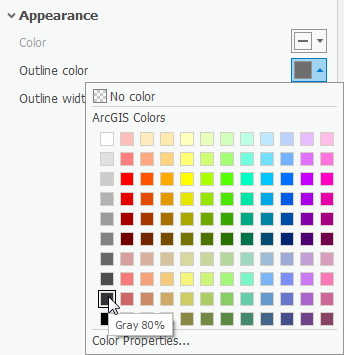
- Expand the Appearance drop-down section.
- Click on the color box associated with Outline color.
- Hover over the colors until the labels appear, and select Gray 80%.
- Click on the color box associated with the Outline color again.
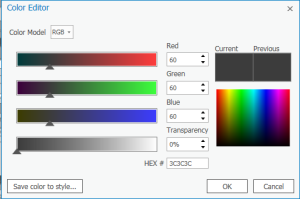
- At the bottom of the pane, select Color Properties...
- In the pop-up Color Editor box, change the Red, Green, and Blue values to 60.
- Make sure the HEX # is 3C3C3C and click OK.
- Change the Outline width to 0.5 pt.
- At the bottom of the pane, click Apply.
...
- Drag the service layer credits off of the Layout.
- In the Insert ribbon, in the Map Surrounds group, click the North Arrow drop-down menu.
- Select the middle arrow in the first row.
...
- Click and drag to create the arrow.
- Move the North Arrow to the lower right corner of the map.
- In the Contents pane, click on the North Arrow layer. The Format North Arrow pane pops up on the right.
- Under the North Arrow drop-down menu, select Point Symbol.
- Click the color box associated with the Color field. Select Gray 50%. Click Apply.

- In the Insert ribbon, in the Map Surrounds group, click the Scale Bar drop-down menu.
- Select Alternating Scale Bar 1.
- Drag Click and drag to create the scale bar down to the middle bottom of your layout. Resize the scale bar until you can see the numbers clearly.
- Notice that the Format Scale Bar pane has popped up to the right. Instead of Scale Bar, select Text Symbol to the top.
- Under Size, choose 8 pt. Under the Color box, choose Gray 50%. At the bottom, click Apply.
- Click the Scale Bar drop-down menu. Select Background. Under Outline Color, right-click the associated color box and choose Gray 50%.
- Click the Scale Bar drop-down menu. Repeat changing the colors to Gray 50% for the Background, Shadow, Numbers, Units, Symbol 1 , and Symbol 2.
- In the Contents pane to the left, click the Map Frame layer.
- In the Format Map Frame pane to the right, click the Map Frame drop-down menu. Select Border.
- Change the Color to No color and select Apply.
...
- In the Insert ribbon, in the Map Surrounds group, click Legend.
- Drag and release a large rectangle around the blank space at the bottom of the map to place the Legend.

- In the Contents pane, click on the Legend layer.
- Under Legend, for Title uncheck Show
- In the Format Legend pane to the right, under the Legend Items section, click the Show properties... button.
- Under the Show list, uncheck Layer name.Resize the Legend box so that it fits in the space provided.

- Under Arrangement, change Arrangement to Description | Patch | Label
- If you are still in the Format Legend Item pane, click the top left back arrow in the pane.
The legend cannot show its entire contents because the font is too large. Let's change the fitting strategy so everything fits.
- At the top of the Format Legend pane, select the Legend Arrangement Options tab.
- Under the Fitting Strategy drop-down, select Adjust Font Size.
- Change the Minimum font size until the legend fits all its text.
- Under the Legend drop-down menu, select Headings. Expand Appearance.
- Change the Color to Gray 80% and click Apply.
- Under the Legend drop-down menu, select Labels.
- Change the Color to Gray 80% and click Apply.
...
- In the Share ribbon, in the Export Output Group, click the Export Layout button with the green arrow.

- Navigate to your LayoutTutorialData folder on the Desktop.
- Make sure the Save as type is TIFF (*.tif) and the Resolution (DPI) is set to 600.
- Click Export.
...