...
Notice that the ClimateProtectionAgreementCities feature class you just exported is now contained in this geodatabase.
- Right-click the US_States feature class and select Add To Current Map.
You will now examine the US_States layer’s attribute table.
...
The goal of performing a spatial join is to add a numeric field to the end of this attribute table that tells you how many participating cities are contained within each state.
- Close the US_States attribute table view.
- In the Contents pane, right-click the US_States layer and select Joins and Relates > Spatial Join.
- For the ‘Join Features’ drop-down menu, select the ClimateProtectionAgreementCities layer.
...
- For the ‘Output Feature Class’ drop-down menu, select the Browse button next to it, ensure it is within the XYData.gdb, and name it “US“US_States_WithCityCounts”WithCityCounts”. Click Save and click Run.
The new layer should appear at the top of your Contents pane.
- At the top of the Contents pane, right-click the US_States_WithCityCounts layer and select Attribute Table.
- Notice the newly-added Join_Count field. This field tells you how many participating cities are contained within each state.
- Close the attribute US_States_WithCityCounts table view.
Since the new layer contains all of the same information as the old US_States layer, plus the new Count field, you no longer need the US_States layer.
- In the Contents pane, right-click the US_States layer and select Remove.
- Right-click the US_States_WithCityCounts and select Symbology.
- In the Symbology pane, in the Symbology drop-down menu, select Graduated Colors.
- In the ‘Fields’ drop-down menu, select the Join_Count field.
...
- On the Desktop, double-click the XY folder.
- Double-click Cities_ClimateProtectionAgreementMayors to open the file with Excel.
...
- Under ‘3. Geocode simple tabular data’, click the link to the text/GPX conversion utility.
- Return to the Excel spreadsheet.
- Click the Select All button in the top left corner of the spreadsheet.
...
- In the Home tab, click Copy.
- Return to GPSVisualizer.
- In the ‘Or paste your data here:’ box, delete all existing text.
- Right-click in the ‘Or paste your data here:’ box and select Paste to copy in the city data from your Excel worksheet.
- Click Convert.
...
- Towards the top of the window, right-click the link that says following link and select Save Link As…. (Yours will have a different download number than shown below.)
- Double-click the XY folder.
- Rename your file “LatLongMayors” and click Save.
- Return to Excel.
- At the bottom of the worksheet click the Insert Worksheet button.
- Click the Data tab.
- Under the ‘Get External Data’ section, click From Text.
- Navigate to select your saved LatLongMayors text file (Desktop > XYTutorialData > LatLongMayors) and click Import.
- In the ‘Text ImportWizard’ window, ensure that Delimited is selected and click Next >.
...
- In the ‘Delimiters’ box, ensure that Tab is checked and that the column break lines appear in the correct locations in the ‘Data preview’ box, as shown below, and click Next >.
...

- Click Finish.
- In the Import Data window, click OK.
...
- Click cell D2 to select it.
- In the formula bar, highlight the degree symbol (°) and press Ctrl+C to copy it.
- Click column D to highlight the entire column.
- At the top of the Excel window, click the Data tab.
...
- In the ‘Data preview’ box, click the second column containing the apostrophes to select it.
- In the ‘Column data format’ box, select Do not import column (skip).
...

- Repeat steps 7 and 8 with the fourth column containing the quotation marks and the fifth column containing the letter W.
- Click Finish.
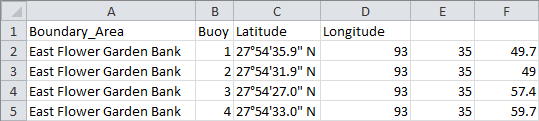
Your spreadsheet should now appear like that shown below. If you have any additional columns, showing because they were not marked to be skipped, delete them now.
Using the DMS to DD Conversion Formula
...
- Double-click the black box in the bottom right of cell G2 to copy the formula down the table.
...
Your longitude coordinates are now in decimal degrees format; however, the cells currently contain formulas, which cannot be read by ArcGIS. To solve this problem, you will copy the values of the equations to a new column.
...