...
- In the Contents pane to the left, right-click the USStatesPopTimeline layer name and select Attribute Table.
...
- At the bottom of the Geoprocessing pane, click the Catalog tab.
- In the GeographicDistributionData geodatabase, right-click the HoustonFreewaysDissolved feature class and select Add To New Map.
- Right-click the InnerLoopRoadsDissolved feature class and select Add To Current Map.
Road data is typically segmented, such that the length of road between each pair of intersections is a separate feature. In this tutorial, we are asking what is the average length of roadway with a single name, so the road layer was previously dissolved on the road name field, such that all road segments with the same name are merged into a single feature. The roads layer was also clipped to approximately the extent of the Inner Loop.
- At the bottom of the Catalog pane, click the Geoprocessing tab.
- At the top of the Geoprocessing pane, click the Back arrow button.
- Within the Measuring Geographic Distributions toolset, click the Linear Directional Mean tool.
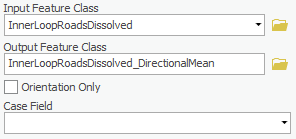
- For the ‘Input Feature Class’, use the drop-down menu to select the InnerLoopRoadsDissolved layer.
- For ‘Output Feature Class’, rename the feature class "InnerLoopRoadsDissolved_DirectionalMean".
- Ensure your Linear Directional Mean tool parameters are configured as shown below and click Run.
- In the Contents pane, right-click the InnerLoopRoadsDissolved layer name and select Zoom To Layer.
Notice that the result points in the same direction as the longest roads in downtown Houston. This result indicates that the majority of roads run in a true North-South and East-West direction, which would average out to 45 degrees.
Freeways
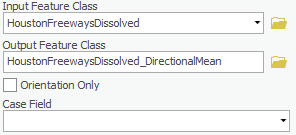
- For the ‘Input Feature Class’, use the drop-down menu,to select the HoustonFreewaysDissolved layer.
- For ‘Output Feature Class’, rename the feature class "HoustonFreewaysDissolved_DirectionalMean".
- Ensure your Linear Directional Mean tool parameters are configured as shown below and click Run.
- In the Contents pane, right-click the HoustonFreewaysDissolved layer name and select Zoom To Layer.
Notice how much longer the linear mean is for the freeways than for all roads. The length is approximately the diameter of Beltway 8, which is the middle of three beltways in Houston. Notice that the direction is also shifted, because the freeways do not run orthogonally, like the local streets.