...
- In the Map ribbon, in the Layer group, click Basemap and select Light Gray Canvas.
- In the Contents pane, uncheck the World Light Gray Reference layer to toggle it off.
- In the Catalog pane, in the Databases folder, expand the LayoutTutorialData.gdb geodatabase.
- Right-click the BlockGroupCensusData feature class and select"Add to Current Map."

...
- Click the Label cell for the first class that reads "≤50000" and type "$0 - $50,000." Press Enter.
- Click the Label cell for the second class that reads "≤90000" and type "$50,001 - $90,000." Press Enter.
- Click the Label cell for the third class that reads "≤150000" and type "$90,001 - $150,000." Press Enter.
- Click the Label cell for the fourth class that reads "≤250001" and type "$150,001 - $250,001." Press Enter.

Editing Class Symbology
...
- Click the More drop-down menu to the top right
...
- of the Upper value table.
- Under Symbols, click Format all symbols.

- At the top of the pane, note how Gallery is selected by default. Select Properties.
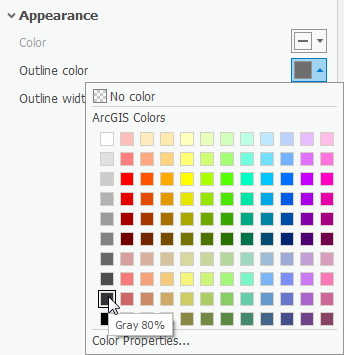
- Expand the Appearance drop-down section.
- Click on the color box associated with Outline color.
- Hover over the colors until the labels appear, and select Gray 80%.
- Click on the color box associated with the Outline color again.
- At the bottom of the pane, select Color Properties...
- In the pop-up Color Editor box, change the Red, Green, and Blue
...
- values to 60.
...
- Make sure the HEX # is 3C3C3C and click OK.

...
- Change the Outline width
...
- to 0.5 pt.
...
- At the bottom of the pane, click Apply.
In the Contents pane to the left, notice that there is a Legend-like display for the BlockGroupCensusData layer.
- Right-click the color box next to the $0 - $50,000 field. Notice that a color drop-down menu appears.
- Hover over the colors until the label appears, and select Gray 10%.
- Right-click the color box next to the $50,001 - $90,000 field. Select Gray 30%.
- Right-click the color box next to the $90,001 - $150,000 field. Select Gray 50%.
- Right-click the color box next to the $150,001 - $250,001 field. Select Gray 70%.
On the Contents pane to the left, notice that under the BlockGroupCensusData layer name, there is a subtitle of the field symbolized upon that reads MEDIAN_HOUSE_INCOME symbology title.
- Click the MEDIAN_HOUSE_INCOME title twice until the text is editable.
Type "Median Household Income by Census Block Group." Hit Enter.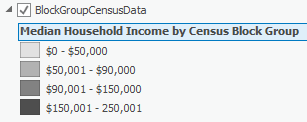
...
Establishing the Layout
Creating the Layout
- In the Insert ribbon, in the Project Group, click New Layout.
- At the bottom of the drop-down menu, select Custom page size...
- In the General tab on the pop-up Layout Properties box, type "Median Household Income by Census Block Group" in the Name field.
- Click the Page Setup tab to the left. Notice how the default 8.5" x 11" page size is selected.
- Change the Width to 5.
- Change the Height to 4.
- At the bottom of the pop-up, click OK.
A new Layout opens. Notice how a new Layouts folder has appeared in the Catalog pane with this Layout in it.
- On the Insert ribbon, click the Map Frame title with the drop-down arrow.
- Select the frame that contains the "Median H..." name.

- Right-click the 0" mark on the horizontal ruler at the top of the Layout. Select Add Guide.
- At the 5" mark on the horizontal ruler, right-click and select Add Guide.
- Repeat at the 0" and 4" marks on the vertical ruler.
- Select the Map Frame in the center of the Layout. Click and drag the corners to snap to the guides on the corner of the Layout.
- In the Contents pane to the left, expand the Map Frame layer. Expand the original map Median Household Income by Census Block Group layer.
- Right-click on the BlockGroupCensusData layer and select Zoom To Layer.
In the Insert ribbon in the Project group, click New Layout>Custom page size.
Under General, for the Name, type: Median Household Income by Census Block Group.
Under Page Setup, change the Width and Height to 5 x 4 inches. Click OK.
In the Insert ribbon in the Map Frames group, click Map Frame, and under the Median Households group, click Harris County. This zooms the map to the Harris County bookmark created earlier.
On the top rulers, at 0” and 5”, right click and Add Guide. Repeat on the left side. Snap the corners to the guides.
In the Layout ribbon, in the Map group, click Activate. In the Map ribbon, in the Navigate group, click Bookmarks>Harris County. Scroll into the map as wide as it will let you without Harris County extending beyond the map frame borders.
Click and drag the map up so that there is an inch of space at the bottom of the map for a legend.
...