...
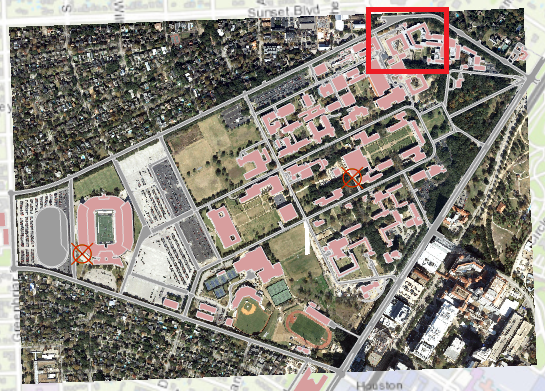
- Visually, identify Martel College in both the aerial layer and the buildings layer.
- In the ribbon, click the Map tab and click the Explore button.
- In the northern-most portion of campus, hold down Shift and click and drag a box around Martel College in both layers to zoom into the area in which you will add your third control point.
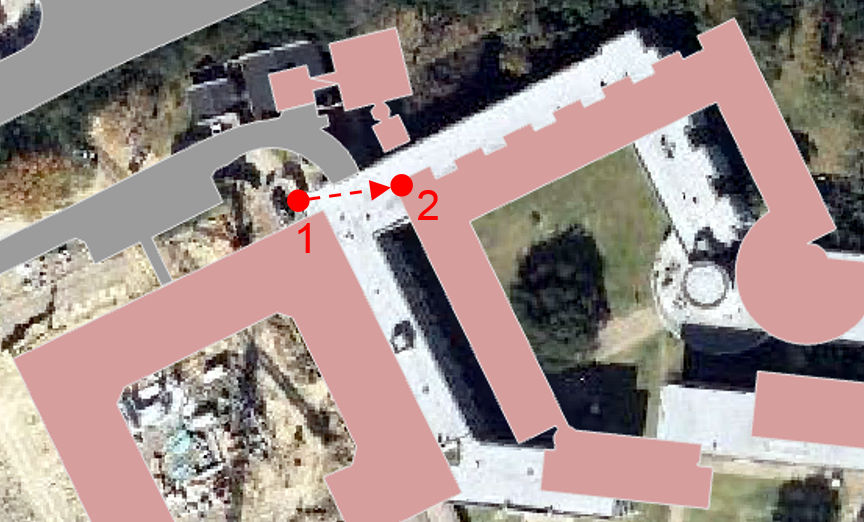
- In the Georeferencing toolbar, click the Add Control Points button.
- Click on the northwest corner of Martel College in the aerial layer.
- With a line linking to the first point you clicked on, click on the northwest corner Martel College on the buildings layer.
- In the Table of Contents, right-click the streets layer and select Zoom to Layer to return to the full extent of the image.
...
- In the ribbon, on the Georeference tab, click the Control Point Table button.
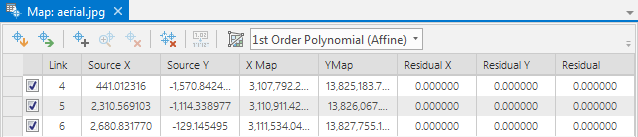
This table lists all the control points you have added. The residual, in the final column of the table, is a measure of how distorted the image has become. A lower residual indicates that the georeferenced image has less distortion from the original image. It not necessary to obtain a residual of zero, as this is difficult unless both layers are from the same source or were already in the same coordinate system.
...