...
- In the Catalog pane on the right, expand the Folders folder.
- Expand the Interpolation folder.
- Expand the Interpolation.gdb geodatabase.
- Right-click the Texas feature Hurricane feature class and select Add To New Map.
The state of Texas appears in your new Map view.
- In the Catalog pane, right-click the Hurricane feature class and select Add To Current Map.
The rings represent the particular wind speed readings for the hurricane.
...
Repeat all steps in this Mapping XY Data section using the Houses table. Rename the exported feature class “Houses” and then remove the Sheet1$_Layer layer and Houses table from the Table of Contents pane.
Your Map Display now shows the locations of all of the houses filing insurance claims due to the hurricane and you have all the layers necessary layers for analysis added into your map document.
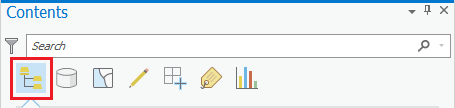
- At the top of the Contents pane, click the List by Drawing Order icon button.
- Click and drag the right edge of the Contents pane back to the left, so that it is only wide enough to display the short layer names.
...
Interpolation allows you to estimate the values of new data points based on the values of existing data points. In this case, you would like to estimate the rainfall values at each of the house locations based on the rainfall values recorded at each of the rain gauge locations. The following section will teach you several methods of interpolating both point and line vector data into raster datasets, which provide estimated values of the data variables across the entire region. You will see how these different interpolation techniques lead to varying variations in the resulting raster datasets. It is important to select an interpolation technique best suited to your existing data and your desired analysis.
...
At this point, only the Rainfall and Texas and Topographic basemap layers should be visible.
Inverse Distance Weighted Interpolation Method
- In At the top of the Geoprocessing pane, click the Back arrow button.
- At the top of the Geoprocessing pane, click the Toolboxes tab.
- Double-click the Spatial Analyst Tools toolbox > Interpolation > Interpolation toolset.
- Click the IDW (Inverse Distance Weighted) tool.
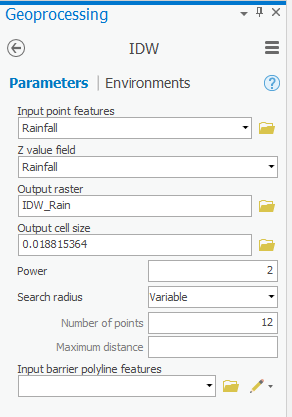
- In the ‘IDW’ windowFor ‘Input point features’, use the ‘Input point features’ drop-down box menu to select the Rainfall layer, which contains your rain gauge data pointspoint locations.
- Use the For ‘Z value field’, use the drop-down box menu to select the Rainfall field that contains the values rainfall measurements you wish to interpolate.
- For ‘Output raster’, rename the exported raster from “Idw_Rainfall1” to “IDW_Rain”.
- Leave the other fields with their default settings, ensure your ‘IDW’ window Ensure that your IDW tool Parameters tab appears as shown below , and and click Run.
It will take several seconds for the tool to begin running, at which point you will see the name of the tool across along the bottom portion of the Geoprocessing pane. When the tool has finished running, a box will pop up in the same corner with the name of the tool and a green checkmark.
Currently, you cannot see most of the newly interpolated raster layerYou can no longer see the Topographic basemap, because it is currently drawn beneath the Texas layer.
- Drag the IDW_Rain layer to the top of the Contents pane, above the Houses layer, so that it is fully visible.
Now you cannot see the interpolation points, because they are beneath the new new IDW_Rain raster layer. To make them both visible, you will make the raster layer transparent.
- In the Contents pane, click the IDW_Rain layer to select it.
- Click the Display tab.
- Under Feature Layer, on In the ribbon on the top, click the Appearance tab, in the Effects group, adjust the Layer Transparency slider to 40%.
...