...
Inverse Distance Weighted Interpolation Method
Typically, you would use the 'Find Tools' search box at the top of the Geoprocessing pane to search for the name of the tool you'd like to use, but, at times, especially when learning the software, it can be helpful to view the full hierarchy of all the tools available, because you will often discover related and helpful tools that you didn't know existed and wouldn't know to search for. You might also completely forget the name of a tool, but be able to locate it based on the hierarchy. For these reasons, we will be manually navigating the toolboxes throughout this tutorial. The more typical workflow of searching directly for a specific tool is covered at the end of the Introduction to Geoprocessing tutorial.
- At the top of the Geoprocessing pane, click the Back arrow button.
- At the top of the Geoprocessing pane, click the Toolboxes tab.
- Double-click the Spatial Analyst Tools toolbox > Interpolation toolset.
- Click the IDW (Inverse Distance Weighted) tool.
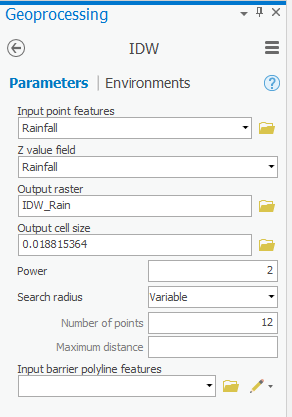
- For ‘Input point features’, use the drop-down menu to select the Rainfall layer, which contains your rain gauge point locations.
- For ‘Z value field’, use the drop-down menu to select the Rainfall field that contains the rainfall measurements you wish to interpolate.
- For ‘Output raster’, rename the exported raster from “Idw_Rainfall1” to “IDW_Rain”.
- Ensure that your IDW tool Parameters tab appears as shown below and click Run.
It will take several seconds for the tool to begin running, at which point you will see the name of the tool along the bottom portion of the Geoprocessing pane. When the tool has finished running, a box will pop up in the same corner with the name of the tool and a green checkmark.
...
- In the Contents pane, click the IDW_Rain layer to select it.
- In the ribbon on the top, click the Appearance tab
- In , in the Effects group, adjust the Layer Transparency slider to 40%.
Notice that you can now see the other layers basemap beneath the raster layer in the Map Display window.
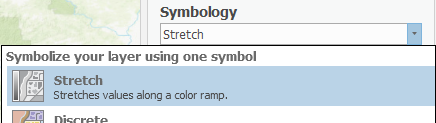
The raster layer is currently symbolized using nine classes; however, the values of the cells in the raster are actually more continuous in nature, so you will symbolize them continuously, rather than in classes.
- Right In the Contents pane, right-click the IDW_Rain layer and select Symbology.
- At the top, beneath For ‘Symbology,’ ’ use the drop-down menu to select Stretch.
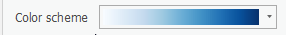
- Use the For ‘Color scheme’, use the drop-down box to select a continuous blue color ramp.
You can now see the continuously interpolated raster containing rainfall values that were generated using the data collected at the specific rain gauge points. Notice how this IDW method results in distinct rings around each input data point.
- In the Contents pane, uncheck the IDW_Rain layer.In
Spline Interpolation Method
- At the bottom of the Symbology pane, click the Geoprocessing tab.
- At the top of the Geoprocessing pane, click the Toolboxes tab click the Back arrow button.
- In Within the Interpolation toolset,double- click the the Spline tool tool.
- Repeat steps steps 5-16 above in the the Inverse Distance Weighted Interpolation Method section section on pages 12 and 13, but but rename the the raster output “Spline“Spline_Rain”.
...
- Rain”.
Compare the result of the Spline interpolation to the result of the IDW interpolation by turning each layer on and off in the Table of Contents. Since the layers are transparent, you need to ensure that only one raster is turned on at a time. Notice how the Spline interpolation tries to reduce the sharp edges and sudden jumps in data and does not exhibit the distinct rings around the input points, as the IDW method does. The Spline interpolation process assumes that, overall, there is a smooth transition in the data and tries to mirror that effect in its output.
- In the Contents pane, uncheck the Spline_Rain layer and any other raster layers you turned on.
Natural Neighbors Interpolation Method
- At the top of In the Geoprocessing pane, click the Toolboxes tab click the Back arrow button.
- In Within the Interpolation toolset,double- click the the Natural Neighbor tool.
- Repeat steps steps 5-16 above in the the Inverse Distance Weighted Interpolation Method section section on pages 12 and 13, but but rename the the raster output “NN“NN_Rain”Rain”.
Natural Neighbors Interpolation Method
Compare the result of the Natural Neighbors interpolation to the results of the previous two interpolation methods. Note that it is smooth everywhere except for the distinct highs and lows directly around the data points, though even at the data points it is smoother than in the IDW interpolation method. Note also that the interpolation is limited to the area covered by the input points, rather than a rectangle of the same extent.
- In the Contents pane, uncheck the NN_Rain layer and any other raster layers you turned on.
...
Using the Create TIN tool, you can create a TIN based on an existing feature class.
- In At the top of the Geoprocessing pane, click the Toolboxes tab click the Back arrow button.
- Double-click Collapse the Spatial Analyst Tools toolbox to collapse it.
- Double-click the 3D Analyst Tools toolbox > Data Management toolset > TIN > toolset.
- Click the Create TIN tool.
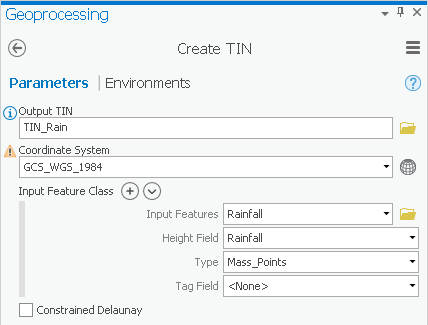
- For ‘Output TIN’, type “TIN_Rain” and click elsewhere to update the text field.
- Use the ‘Coordinate System’ drop-down box to select the Rainfall feature class.
- Use the ‘Input Features’ drop-down box to select the Rainfall feature class.
- Use the ‘Height Field’ drop-down box to select the Rainfall field.
- Ensure your ‘Create TIN’ window appears as shown below and click Run.
This method interpolates the rainfall data points by defining the vertices of each triangle in the TIN and interpolating across each triangle. From here, it is very simple to convert the TIN to a raster, so that it is in the same format as your other interpolation layers.
- In the Geoprocessing pane, click the collapse the Data Management toolset to collapse it.
- In the 3D Analyst Tools toolbox, double-click the Conversion toolset > From TIN > toolset.
- Click the TIN to Raster tool.
- Use the ‘Input TIN’ drop-down box to select the TIN_Rain TIN.
- For ‘Output raster’, rename the exported raster from “TIN_Rain_Tin” to “TINRast_Rain”.
- Ensure your ‘TIN to Raster’ window appears as shown below and click Run.
- In the Contents pane, uncheck the TIN_Rain layer to view the new raster layer created from the TIN.
- Repeat steps 11-16 above in the Inverse Distance Weighted Interpolation Method section on page 12 to symbolize the TINRast_Rain layer as you did the other raster layers.
...
- In the Contents pane, uncheck all layers, except for the Texas Topographic basemap layer.
Line Interpolation
You will now try interpolating the Hurricane line feature class using the same TIN-based method you just used to interpolate the rainfall point data. Recall that the Hurricane feature class contains a Windspeed field in its attribute table, which tells you the peak average wind speed along each line at the time the hurricane landed.
- In the Contents pane, check the Hurricane layer to make it visible.
- In the Analysis Tab, click the Tools button.
- In the At the top of the Geoprocessing pane, click the Toolboxes tab click the Back arrow button.
- In ArcToolbox navigate to 3D Analyst Tools > Data Management > TIN > Create TIN.
- For ‘Output TIN’, type “TIN_Wind” and click elsewhere to update the text field.
- Use the ‘Input Feature’ drop-down box to select the Hurricane feature class.
- Use the ‘Height Field’ drop-down box to select the Windspeed field as shown below.
- Use the ‘Coordinate System’ drop-down box to select the Houses layer.
- Ensure your ‘Create TIN’ window appears as shown below and click Run.
...
Extracting Multi Values to Points
- In the Analysis Tab, click the Tools button.In the Toolboxes tab, click the 3D Analyst Tools toolbox to collapse it.
...
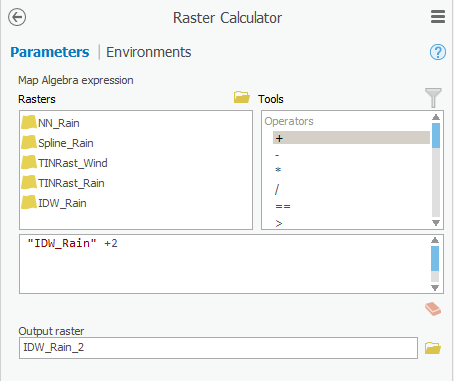
- In the Geoprocessing pane, in the Spatial Analyst Tools toolbox, douclick the Map Algebra toolset > Raster Calculator.
- Under ’Rasters’, double-click the IDW_Rain layer.
- Under ‘Operators’, click the + operator.
- For ‘Output raster’, rename the exported raster from “idw_rain_ras” to “IDW_Rain_2”.
- Ensure your ‘Raster Calculator’ window looks like that shown below and click Run.
You have now learned multiple methods of interpolating point and line data into raster data and extracting raster data at point locations. You have also reviewed skills from other short courses, including mapping XY data.
...