...
- In the Geoprocessing pane, collapse the Data Management toolset.
- In the 3D Analyst Tools toolbox, double-click the Conversion toolset > From TIN toolset.
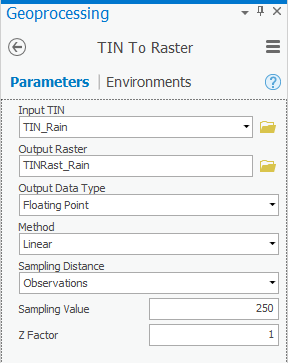
- Click the TIN to Raster tool.
- Use the ‘Input TIN’ drop-down box to select the TIN_Rain TIN.
- For ‘Output raster’, rename the exported raster from “TIN_Rain_Tin” to “TINRast“TINRast_Rain”Rain”.
- Ensure your ‘TIN to Raster’ window appears as shown below and click Run.
- In the Contents pane, uncheck the TIN_Rain layer to view the new raster layer created from the TIN.
- Repeat steps 11-16 above in the Inverse Distance Weighted Interpolation Method section on page 12 to symbolize the TINRast_Rain layer as you did the other raster layers.
...
- In the Contents pane, check the Hurricane layer to make it visible.
- At the top of the Geoprocessing pane, click the Back arrow button.
- In ArcToolbox navigate to 3D Analyst Tools > Data Management > TIN > Create TIN.
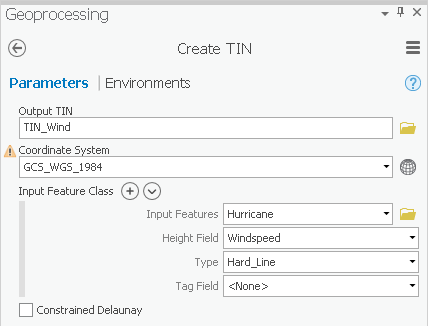
- For ‘Output TIN’, type “TIN_Wind” and click elsewhere to update the text field.
- Use the ‘Input Feature’ drop-down box to select the Hurricane feature class.
- Use the ‘Height Field’ drop-down box to select the Windspeed field as shown below.
- Use the ‘Coordinate System’ drop-down box to select the Houses layer.
- Ensure your ‘Create TIN’ window appears as shown below and click Run.
Again, you need to convert the TIN to a raster, so that it is comparable to the other interpolation layers.
...
- Click Data Management Tools > Projections and Transformations > Define Projection
- In the ‘Input Dataset or Feature Class’ drop-down box, click TINRast_Rain.
- For ‘Coordinate System’, click the icon to the right of the box, shown below.
- Double-click Geographic Coordinate Systems to expand it. Scroll down to World, and double-click World. Select WGS 1984. Click OK.
- Ensure that the ‘Define Projection’ window appears as shown below and click OK.

- Repeat steps 3-7 for TINRast_Wind, except for the ‘Input Dataset or Feature Class’ drop-down select TINRast_Wind.
- Click Spatial Analyst Tools > Extraction > Extract Multi Values to Points.
- Use the ‘Input point features’ drop-down box to select the Houses layer.
- Use the ‘Input rasters’ drop-down box to select all five interpolation rasters you created earlier one at a time: IDW_Rain, Spline_Rain, NN_Rain, TINRast_Rain and TINRast_Wind. The order in which the rasters are listed is the same order in which the extracted value columns will appear in the output feature class attribute table.
- Check Bilinear interpolation of values at point locations.
- Ensure your ‘Extract Multi Values to Points’ window appears as shown below and click Run.

The Extract Multi Values to Points tool simply adds a field for the value of each raster to the end of your existing Houses attribute table, which is why you were not asked for an output location.
- In the Contents pane, right-click the Houses layer and select Attribute Table.
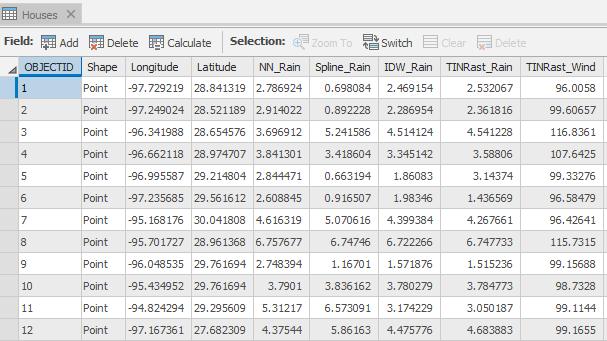
Notice the five new fields added to the end of the existing attribute table which contain the values of each of the five rasters at each house location. Notice also the differences in rainfall estimates resulting from the four different interpolation techniques. At many house locations, the value of the Spline interpolation is the most different from the other interpolation method values.
...
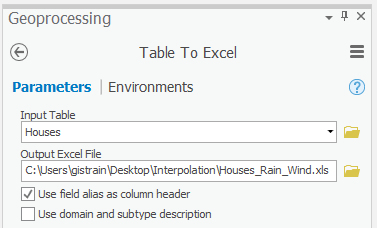
- For ‘Output Excel File’, replace “Houses_TableToExcel” with “Houses_Rain_Wind”.
- Check Use field alias as column header.
- Ensure your ‘Table To Excel’ pane looks like that shown below and click Run.
Now you have what the insurance company is looking for: a single text file containing the locations of the houses in question, as well as the corresponding rainfall and wind speed estimates to use in completing a damage quote for your customers.
...