...
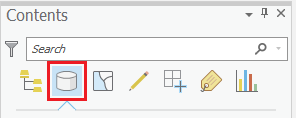
- At the top of the Contents pane, click the List By Data Source button.
- If you cannot see the entire file paths, hover over the right edge of the Contents pane until your cursor turns into a double-sided arrow.
- Click and drag the right edge of the Contents pane to the right until you can see the full file paths.
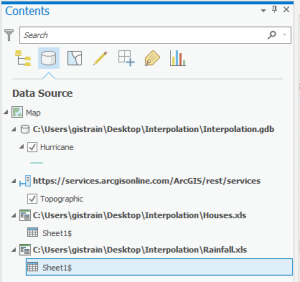
Now you can see the name of the Excel file from which each Sheet1$ originated, but to avoid further confusion, you will rename the Excel worksheet layers. This action will not rename the worksheets in the actual Excel file, but only how they are listed in the Contents pane in this particular Map.
...
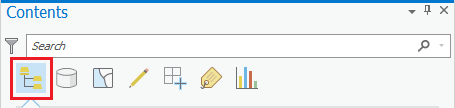
- At the top of the Contents pane, click the List by Drawing Order button.
- Click and drag the right edge of the Contents pane back to the left, so that it is only wide enough to display the short layer names and the List by... icons.
Interpolating Data
Interpolation allows you to estimate the values of new data points based on the values of existing data points. In this case, you would like to estimate the rainfall values at each of the house locations based on the rainfall values recorded at each of the rain gauge locations. The following section will teach you several methods of interpolating both point and line vector data into raster datasets, which provide estimated values of the data variables across the entire region. You will see how these different interpolation techniques lead to variations in the resulting raster datasets. It is important to select an interpolation technique best suited to your existing data and your desired analysis.
...
- In the Contents pane, right-click the IDW_Rain layer and select Symbology.
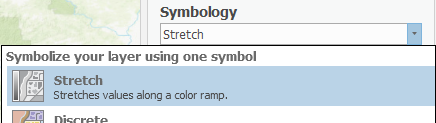
- For ‘Symbology,’ use the drop-down menu to select Stretch.
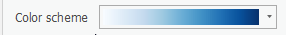
For ‘Color scheme’, use - Click the drop-down Color scheme menu. Select the Show names check box at the bottom.
- Scroll down the color scheme list and select the Blues (Continuous) box to select a continuous blue color ramp.
You can now see the continuously interpolated raster containing rainfall values that were generated using the data collected at the specific rain gauge points. Notice how this IDW method results in distinct rings around each input data point, because it treats each data point as a local max or min.
...
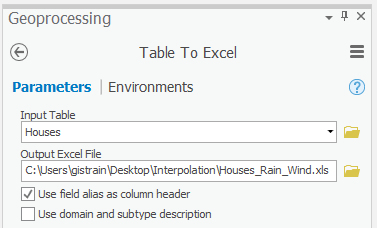
- For ‘Output Excel File’, rename the Excel file from Houses_TableToExcel to “Houses_Rain_Wind”.
- Check Use field alias as column header.
- Ensure that your 'Table To Excel' tool Parameters tab appears as shown below and click Run.
Now you have what the insurance company is looking for: a single text file containing the locations of the houses in question, as well as the corresponding rainfall and wind speed estimates to use in completing a damage quote for your customers.
...