...
- In the Contents pane, right-click the Census_2010_By_Superneighborhood layer name and select Symbology.
- Use the primary 'Primary symbologySymbology' drop-down menu to select Graduated Colors.
- Use the 'Field:' drop-down menu to scroll down sixth from the bottom and select the SUM_Vacant field. This field stores the number of vacant housing units within each neighborhood.
...
- Use the 'Normalization' drop-down menu to select the Shape_Area field.
Discuss density and changes on map
- Use the 'Normalization' drop-down menu to select the SUM_HU100 field.
Discuss percent and changes on map.
- On the lower half of the Symbology pane, click the Histogram tab.
Discuss and test classification methods.
- Use the 'Method" drop-down menu to select Equal Interval.
- Use the 'Method" drop-down menu to select Quantile.
Discuss and test number of classes.
- Use the 'Classes' drop-down menu to select 20.
- Use the 'Classes' drop-down menu to select 4.
Discuss and test color schemes.
Adding Layer Transparency
- Ensure that the Census_2010_By_SuperNeighborhood layer is selected.
- In the ribbon, click the Feature Layer contextual Appearance tab.
- In the Effects group, slide the Layer Transparency slider or type "50" and hit Enter.
Symbolizing Layers By Category
- Use the 'Primary symbology' drop-down menu to select Unique Values.
- Use the 'Field 1' drop-down menu to select Name.
- In the Contents pane, collapse the Census_2010_By_Superneighborhood symbology.
----------------------------------------------------------------------
Discuss density and changes on map
----------------------------------------------------------------------
- Use the 'Normalization' drop-down menu to select the SUM_HU100 field.
----------------------------------------------------------------------
Discuss percent and changes on map.
----------------------------------------------------------------------
- On the lower half of the Symbology pane, click the Histogram tab.
----------------------------------------------------------------------
Discuss and test classification methods.
----------------------------------------------------------------------
- Use the 'Method" drop-down menu to select Equal Interval.
- Use the 'Method" drop-down menu to select Quantile.
----------------------------------------------------------------------
Discuss and test number of classes.
----------------------------------------------------------------------
- Use the 'Classes' drop-down menu to select 20.
- Use the 'Classes' drop-down menu to select 4.
----------------------------------------------------------------------
Discuss and test color schemes.
----------------------------------------------------------------------
Adding Layer Transparency
- Ensure that the Census_2010_By_SuperNeighborhood layer is selected.
- In the ribbon, click the Feature Layer contextual Appearance tab.
- In the Effects group, slide the Layer Transparency slider or type "50" and hit Enter.
Symbolizing Layers By Category
- Use the primary 'Symbology' drop-down menu to select Unique Values.
- Use the 'Field 1' drop-down menu to select Name.
- In the Contents pane, collapse the Census_2010_By_Superneighborhood symbology.
----------------------------------------------------------------------
zoom into neighborhood, go to explore button, click on neighborhood to find out neighborhood name.
----------------------------------------------------------------------zoom into neighborhood, go to explore button, click on neighborhood to find out neighborhood name.
Selecting Features Programatically
...
- In the ribbon, click the Map tab.
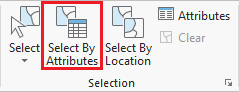
- In the Selection group, click the Select By Attributes button to open the Select Layer By Attribute tool in the Geoprocessing pane.
- In the Geoprocessing pane, click the Add Clause button.
- Use the drop-down menus to build the following expression: Name is Equal to 'YOUR_NEIGHBORHOOD_NAME' and click the Add button.
- Ensure your Geoprocessing pane appears similar to that below and click Run.
...
- In the Contents pane, right-click the Census_2010_By_SuperNeighborhood layer name and select Data > Export Features.
- In the Geoprocessing pane, click the 'Output Feature Class' field to edit the name. Replace Census_2010_By_SuperNeighbor with "MyNeighborhood". Ensure that you leave everything in the file path through Intro.gdb\.
...
- On the ribbon, click the Insert tab.
- In the Project group, click the New Map button.
- At the bottom of the Geoprocessing pane, click the Catalog pane tab.
- Rename My Neighborhood and add MyNeighborhoods, BusStops and BusRoutes.
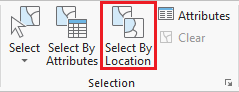
- In the Selection group, click the Select By Location button to open the Select Layer By Attribute tool in the Geoprocessing pane. Select bus stops within neighborhood.
- Select bus routes within 100 ft of bus stop in neighborhood.
...