...
The freeways on the map should now all be black and easily visible on top of the basemap. The Format Symbol mode of the Symbology tab can be accessed directly via the layer symbol (instead of the layer name) in the Contents pane.
- In the Contents pane on the left, select click the colored rectangle symbol beneath the Census_2010_By_SuperNeighborhood layer name.
In the Symbology pane, again click the colored rectangle symbol to switch to Format Polygon Symbol mode.
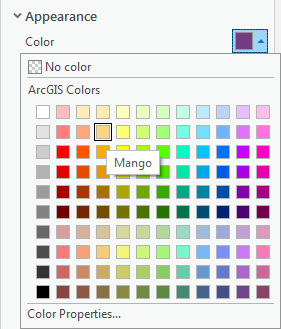
- For 'Color', use the drop-down menu to select Mango.
- For 'Outline color', use the drop-down menu to select Gray 50%.
- At the bottom of the Symbology pane, click Apply.
The super neighborhood polygons are now easy to distinguish from both the basemap and the freeways. In addition, the borders of the super neighborhoods are clear and easy to differentiate from the freeways.
Navigating the Project
Navigating the Contents Pane
...
- In the Contents pane, click and hold the Census_2010_By_SuperNeighborhood layer name and drag and drop it above the Major_Roads layer.
You will notice that, in the Map view, the Census_2010_By_SuperNeighborhood layer is now drawn in on top of the Major_Roads layer, meaning that freeways are only visible in areas not covered by a super neighborhood. It is possible to add transparency to the super neighborhood layer or to symbolize it with a bold outline and a hollow fill, but, in general, it is best to have polygon layers at the bottom of the drawing order, so we will return the layers to their previous order.
- In the Contents pane, click and hold the Census_2010_By_SuperNeighborhood layer name and drag and drop it beneath the Major_Roads layer, but above the Topographic basemap.
| Note |
|---|
Because the basemap is a solid image, any layers beneath it will not be shown at all, so ensure the basemap is always at the bottom of the layers in the Content pane. |
...
You will now learn how to navigate the Map view by panning, zooming, and using spatial bookmarks.
- On the ribbon, click the Map tab.
- Map tab, in the Navigate group, ensure that the Explore button is selected by default.
...
- On the Map tab, in the Selection group, click the Select button.

- In the map view, click on any neighborhood to select it.
The selected neighborhood will be outlined in cyan.
- Drag a box to select multiple adjacent neighborhoods.
- Hold down Shift and click any non-selected neighborhood to add additional non-adjacent neighborhoods to the selection.
- Hold down Ctrl and click any selected neighborhood to deselect neighborhoods.
...
- In the Contents pane, right-click the Census_2010_By_SuperneighborhoodSuperNeighborhood layer name and select Attribute Table.
Discuss variables, default fields and units on
...