...
- Right-click the Census_2010_By_SuperNeighborhood feature class and selectAdd To Current Map.
- An alternative method of adding data to a map is to click and hold the Major_Rivers feature class and drag and drop it into the Super Neighborhoods map view.
- Repeat either method to add Wastewater_Outfalls to the map view.
Symbolizing Layers with a Single Symbol
It is early in the project to be deciding upon symbology, however, when layers are added to a map, ArcGIS Pro assigns then a random color symbol. Sometimes the colors are very faint and difficult to see on top of the basemap or the colors of multiple layers are very similar to each other and difficult to distinguish. To ensure that everyone can easily see the layers we are working with, we will adjust the basic symbology.
...
Notice that the 'Primary symbology' defaults to Single Symbol. With this type of symbology, all features in that particular layer will be assigned the same symbol.
...
The rivers on the map should now all be black and easily visible on top of the basemap. The Format Symbol mode of the Symbology tab can be accessed directly via the layer symbol (instead of the layer name) in the Contents pane.
...
Navigating the Project
Navigating the Contents Pane
At the top of the Contents pane, there is a series of seven buttons. By default, the leftmost button is selected: List by Drawing Order.
When this button is selected, the order in which the layers are listed corresponds to the order in which the layers are visually stacked in the Map view. To test how the drawing order works, you will reorder the layers.
- In the Contents pane, click and hold the Census_2010_By_SuperNeighborhood layer name and drag and drop it above the Major_Roads layer.
You will notice that, in the Map view, the Census_2010_By_SuperNeighborhood layer is now drawn in on top of the Major_Roads layer, meaning that freeways are only visible in areas not covered by a super neighborhood. It is possible to add transparency to the super neighborhood layer or to symbolize it with a bold outline and a hollow fill, but, in general, it is best to have polygon layers at the bottom of the drawing order, so we will return the layers to their previous order.
- In the Contents pane, click and hold the Census_2010_By_SuperNeighborhood layer name and drag and drop it beneath the Major_Roads layer, but above the Topographic basemap.
| Note |
|---|
Because the basemap is a solid image, any layers beneath it will not be shown at all, so ensure the basemap is always at the bottom of the layers in the Content pane. |
The check boxes to the left of each layer name toggle the visibility of each layer.
- Uncheck the Major_Roads layer to turn off its visibility in the map view.
- Check the Major_Roads layer to turn its visibility back on in the map view.
Navigating the Map View
You will now learn how to navigate the Map view by panning, zooming, and using spatial bookmarks.
- On the ribbon, click the Map tab.
- in the Navigate group, ensure that the Explore button is selected by default.
To pan the map:
- Within the map view, click and hold the left mouse button and drag the mouse and release.
To manually zoom:
- Hover your cursor over the area you wish to zoom in to and push the center scroll wheel away from you for incremental zooming. Pull the center scroll wheel towards you to zoom out.
-OR-
- Hover your cursor over the area you wish to zoom in to, hold down the right mouse button, and drag the mouse down for smooth zooming. Drag the mouse up to zoom out.
-OR-
- Hold down Shift such that your cursor changes to a magnifying glass and then click and hold and drag a box around the targeted area of interest to zoom directly to a specific extent.
To zoom to the extent of a particular layer:
- In the Contents pane, right-click the Census_2010_By_SuperNeighborhood layer name and select Zoom To Layer.
A spatial bookmark allows you to quickly return to a particular zoom extent in your Map view.
- On the Map tab, in the the Navigate group, click the Bookmarks button and select New Bookmark....
- In the 'Create Bookmark' window, for 'Name:', type "Houston" and click OK.
- To test the bookmark, use panning and zooming to change the extent of the map.
- Again, click the Bookmarks button and this time select the Houston bookmark to return to that extent.
...
Symbolizing Layers with a Single Symbol
It is early in the project to be deciding upon symbology, however, when layers are added to a map, ArcGIS Pro assigns then a random color symbol. Sometimes the colors are very faint and difficult to see on top of the basemap or the colors of multiple layers are very similar to each other and difficult to distinguish. To ensure that everyone can easily see the layers we are working with, we will adjust the basic symbology.
- In the Contents pane, right-click the Major_Rivers layer name and select Symbology to open the Symbology pane on the right.
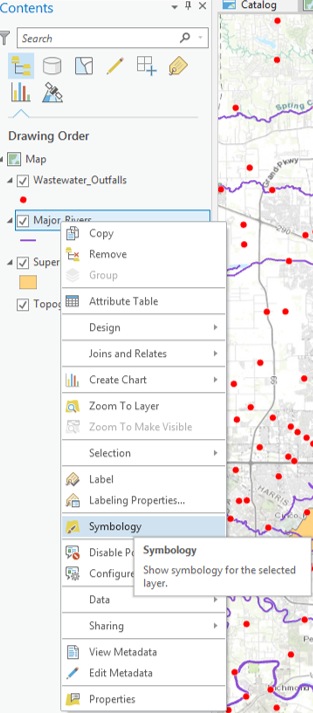
Notice that the 'Primary symbology' defaults to Single Symbol. With this type of symbology, all features in that particular layer will be assigned the same symbol.
- For 'Symbol', click the colored line symbol to switch to Format Line Symbol mode.

- Within Format Line Symbol mode, click the Properties tab.
- For 'Color', use the drop-down menu to select Cretan Blue.
- At the bottom of the Symbology pane, click Apply.
The rivers on the map should now all be black and easily visible on top of the basemap. The Format Symbol mode of the Symbology tab can be accessed directly via the layer symbol (instead of the layer name) in the Contents pane.
- In the Contents pane on the left, click the colored rectangle symbol beneath the Census_2010_By_SuperNeighborhood layer name.
- For 'Color', use the drop-down menu to select Mango.
- For 'Outline color', use the drop-down menu to select Gray 50%.
- At the bottom of the Symbology pane, click Apply.
The super neighborhood polygons are now easy to distinguish from both the basemap and the rivers. In addition, the borders of the super neighborhoods are clear and easy to differentiate from the freeways
...
The super neighborhood polygons are now easy to distinguish from both the basemap and the rivers. In addition, the borders of the super neighborhoods are clear and easy to differentiate from the freeways.
Navigating the Project
Navigating the Contents Pane
At the top of the Contents pane, there is a series of seven buttons. By default, the leftmost button is selected: List by Drawing Order.
When this button is selected, the order in which the layers are listed corresponds to the order in which the layers are visually stacked in the Map view. To test how the drawing order works, you will reorder the layers.
- In the Contents pane, click and hold the Census_2010_By_SuperNeighborhood layer name and drag and drop it above the Major_Roads layer.
You will notice that, in the Map view, the Census_2010_By_SuperNeighborhood layer is now drawn in on top of the Major_Roads layer, meaning that freeways are only visible in areas not covered by a super neighborhood. It is possible to add transparency to the super neighborhood layer or to symbolize it with a bold outline and a hollow fill, but, in general, it is best to have polygon layers at the bottom of the drawing order, so we will return the layers to their previous order.
- In the Contents pane, click and hold the Census_2010_By_SuperNeighborhood layer name and drag and drop it beneath the Major_Roads layer, but above the Topographic basemap.
| Note |
|---|
Because the basemap is a solid image, any layers beneath it will not be shown at all, so ensure the basemap is always at the bottom of the layers in the Content pane. |
The check boxes to the left of each layer name toggle the visibility of each layer.
- Uncheck the Major_Roads layer to turn off its visibility in the map view.
- Check the Major_Roads layer to turn its visibility back on in the map view.
Navigating the Map View
You will now learn how to navigate the Map view by panning, zooming, and using spatial bookmarks.
- On the ribbon, click the Map tab.
- in the Navigate group, ensure that the Explore button is selected by default.
To pan the map:
- Within the map view, click and hold the left mouse button and drag the mouse and release.
To manually zoom:
- Hover your cursor over the area you wish to zoom in to and push the center scroll wheel away from you for incremental zooming. Pull the center scroll wheel towards you to zoom out.
-OR-
- Hover your cursor over the area you wish to zoom in to, hold down the right mouse button, and drag the mouse down for smooth zooming. Drag the mouse up to zoom out.
-OR-
- Hold down Shift such that your cursor changes to a magnifying glass and then click and hold and drag a box around the targeted area of interest to zoom directly to a specific extent.
To zoom to the extent of a particular layer:
- In the Contents pane, right-click the Census_2010_By_SuperNeighborhood layer name and select Zoom To Layer.
A spatial bookmark allows you to quickly return to a particular zoom extent in your Map view.
...
.
...
Exploring Data in the Map View
...