...
- In the Catalog pane on the right, right-click the Census_2010_By_SuperNeighborhood feature class and select Add To Current Map.
- An alternative method of adding data to a map is to click and hold the Major_Rivers feature class and drag and drop it into the Super Neighborhoods map view.
- Repeat either method to add Wastewater_Outfalls to the map view.
Symbolizing Layers with a Single Symbol
It is early in the project to be deciding upon symbology, however, when layers are added to a map, ArcGIS Pro assigns then a random color symbol. Sometimes the colors are very faint and difficult to see on top of the basemap or the colors of multiple layers are very similar to each other and difficult to distinguish. To ensure that everyone can easily see the layers we are working with, we will adjust the basic symbology.
...
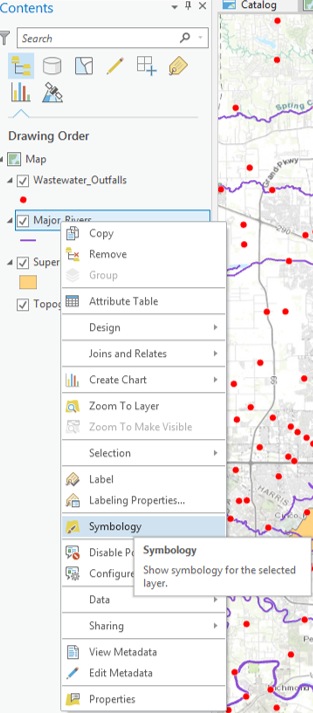
- In the Contents pane, right-click the Major_Rivers layer name and select Symbology to open the Symbology pane on the right.
...
Notice that the 'Primary symbology' defaults to Single Symbol. With this type of symbology, all features in that particular layer will be assigned the same symbol.
- For 'Symbol', click the colored line symbol to switch to Format Line Symbol mode.

- Within Format Line Symbol mode, click the Properties tab.
- For 'Color', use the drop-down menu to select Cretan Blue.
- At the bottom of the Symbology pane, click Apply.
...
The rivers on the map should now all be black and easily visible on top of the basemap. The Format Symbol mode of the Symbology tab can be accessed directly via the layer symbol (instead of the layer name) in the Contents pane.
...
- In the Contents pane on the left, click the colored rectangle symbol beneath the Census_2010_By_SuperNeighborhood layer name.
- For 'Color', use the drop-down menu to select Mango.
- For 'Outline color', use the drop-down menu to select Gray 50%.
- At the bottom of the Symbology pane, click Apply.
...
The super neighborhood polygons are now easy to distinguish from both the basemap and the rivers. In addition, the borders of the super neighborhoods are clear and easy to differentiate from the freeways.
...