...
The best option for getting the full GIS project experience is to download data from online GIS data portals. You will also gain exposure to the best GIS data websites for the Houston region.
...
Obtaining tutorial data
...
If you are completing this tutorial from a personal computer, you will need to download the tutorial data online by following the instructions below:
- Click the following link to download the tutorial data: CEVE101.zip
- Unzip the CEVE101 folder.
- Copy the unzipped CEVE101 folder to your Desktop or another location of your choice. Ensure that you note the file path of the location you have selected.
Any time throughout the tutorial that you see reference to the file path C:\Users\gistrain\Desktop\IntroTutorialData, you will need to substitute it with the file path you have just selected.
The following step-by-step instructions and screenshots are based on the Windows 7 operating system with the Windows Classic desktop theme and ArcGIS Pro 2.1.3 software with an Advanced license. If your personal system configuration varies, you may experience minor differences from the instructions and screenshots.
Obtaining tutorial data from source websites
COHGIS Open Data Portal
The COHGIS (City of Houston GIS) Open Data Portal website provides over 100 data sets including administrative boundaries, amenity locations, transportation routes, crime, and flooding. For this tutorial, we will download population and housing data from the 2010 census, which has been aggregated to super neighborhood boundaries.
...
Whenever you see a URL that ends in opendata.arcgis.com, you will know that you are visiting a standard ArcGIS Open Data portal.
...
In this case, we are looking for census data by super neighborhood. To learn more about super neighborhoods, visit the City of Houston Super Neighbhorhoods webpage.
...
H-GAC GIS Datasets
The Houston-Galveston Area Council (H-GAC) is the 13-county Metropolitan Planning Organization (MPO) for the Houston region. Federal legislation requires that an MPO be designated for each urbanized area with a population greater than 50,000 people (as established by the U.S. Census Bureau) in order to conduct long-range metropolitan transportation planning and be eligible for Federal funding for transportation projects. Their mission to carry out metropolitan transportation planning means that MPOs are a great source of data on topics such as demographics, employment, land use, transportation, and environmental conditions and most of these topics are well-suited towards GIS analysis.
Most of the data provided on the H-GAC portal is not originally created by the H-GAC, but rather is either aggregated from multiple municipalities up to the 13-country region, or clipped from the country or state down to the 13-county region.
...
from source websites
COHGIS Open Data Portal
The COHGIS (City of Houston GIS) Open Data Portal website provides over 100 data sets including administrative boundaries, amenity locations, transportation routes, crime, and flooding. For this tutorial, we will download population and housing data from the 2010 census, which has been aggregated to super neighborhood boundaries.
- Using a web browser, search for "houston gis data" and select the result as shown below or or go directly to: https://cohgis-mycity.opendata.arcgis.com/.

Whenever you see a URL that ends in opendata.arcgis.com, you will know that you are visiting a standard ArcGIS Open Data portal.
- If you are looking for specific data, you can enter a term in the search box, but if you would like to see the full data catalog, click the Search button without entering a search term. You can then browse through the full list of data or filter by topic on the left side.

In this case, we are looking for census data by super neighborhood. To learn more about super neighborhoods, visit the City of Houston Super Neighbhorhoods webpage.
- In the 'Find' box, type "census 2010 by super neighborhood" and press Enter.

- Click Census 2010 By SuperNeighborhood, as shown below.

- In the top right, click Download > Shapefile.
H-GAC GIS Datasets
The Houston-Galveston Area Council (H-GAC) is the 13-county Metropolitan Planning Organization (MPO) for the Houston region. Federal legislation requires that an MPO be designated for each urbanized area with a population greater than 50,000 people (as established by the U.S. Census Bureau) in order to conduct long-range metropolitan transportation planning and be eligible for Federal funding for transportation projects. Their mission to carry out metropolitan transportation planning means that MPOs are a great source of data on topics such as demographics, employment, land use, transportation, and environmental conditions and most of these topics are well-suited towards GIS analysis.
Most of the data provided on the H-GAC portal is not originally created by the H-GAC, but rather is either aggregated from multiple municipalities up to the 13-country region, or clipped from the country or state down to the 13-county region.
- Using a web browser, search for "h-gac gis" and select the result as shown below or go directly to: http://www.h-gac.com/rds/gis-data/gis-datasets.aspx.

- Under the Dataset Categories section, click the Hydrologic button to filter the results by subject.
- Under the Datasets section, click Major Rivers.

- Click Download Dataset.
- Click the blue Download button.
- Back on the H-GAC portal, close the Major Rivers window, and under the Dataset Categories section, click the Water Quality button.
- Under the Datasets section, click Wastewater Outfalls.

- Click Download Dataset.
- Click the blue Download button.
HCAD
Though it is not used in this course, the Harris County Appraisal District (HCAD) Public Data is another great online source that provides similar data such as highways, utilities, and water districts and is available at: http://pdata.hcad.org/GIS/index.html
Preparing the Downloaded Data for ArcGIS Pro
Once you have downloaded the Super Neighborhoods from COHGIS and the Wastewater Outfalls and Major Rivers from H-GAC, you will be able to find the data files in your Downloads folder. All of the files are zipped, meaning they contain compressed files of data within them (you can tell a file is zipped when the file type column reads “Compressed (zipped) Folder”). You will need to unzip the folders to be able to see the data inside them. To do that:
- Using File Explorer, open the Downloads folder.
- Ensure that you see the following zipped folders in your Downloads folder.
- Census_2010_By_SuperNeighborhood
- Major_Rivers
- Wastewater_Outfalls
- Select all three folders.
- Right-click any of the selected folders and select 7-Zip > Extract here.
Your data is in a file folder in its decompressed format and ready to be brought into ArcGIS Pro.
...
Creating a New Project in ArcGIS Pro
- From the Start menu, launch ArcGIS Pro.
- When ArcGIS Pro opens, under the Create a new project section, click the Blank project template.
- In the 'Create a New Project' window, for Name, type "CEVE101".
- For Location, click the Browse... button to the right.
- In the 'Select a folder to store the project.' window, click Computer in the left column and click Desktop in the right column and click OK.

- ClickOK once again.
- Maximize the ArcGIS Pro application window.
Creating a New Map
A map is a project item used to display and work with geographic data in two dimensions. The first step to visualizing any data is creating a new map.
- On the ribbon, click the Insert tab.
- In the Project group, click the New Map button.
You will notice that a new map view opens in the main section of ArcGIS Pro.
The panel on the left side of ArcGIS Pro is called the Contents pane. After creating a new map, the Contents pane now displays the default Map title and automatically adds the Topographic basemap layer to the map.
The panel on the right side of ArcGIS Pro is called the Catalog pane. After creating the first map, a new Maps section has been added to the top of the Project tab within the Catalog pane.
- In the Catalog pane, click the arrow to expand the Maps section.
Notice that there is a single map there, named "Map". Since most projects will have multiple maps, it is a good idea to name your maps with more descriptive titles.
- In the Catalog pane, under the Maps section, right-click Map and select Rename.
- Type "Houston Outfalls" and hit Enter.
Saving a Project
Any time you create a new project item, such as a map or a layout, or any time you spend time adjusting the symbology of your map layers, it is a good idea to save your project.
- Above the ribbon, on the Quick Access toolbar, click the Save button.
Managing GIS Data
- In the Catalog pane on the right, expand Folders > CEVE101 > CEVE101.gdb. There are currently no data in this folder.
- Right-click Folders and select Add Folder Connection.
- In the left column click Computer. in the right column double click C: > Users > gistrain. Single click Downloads and select OK.
- In the Catalog pane, expand Downloads.
- Fully expand all folders and geodatabases in the Downloads folder.
- Drag and drop the Major_Rivers feature class into the CEVE101.gdb
- Repeat drag and drop for Wastewater_Outfalls
- Right-click the CEVE101.gdb and select Import > Feature Class

- Click the Browse button to navigate to input features. In the left column click Folders. In the right column click Downloads > Census_2010_By_SuperNeighborhood. Single click Census_2010_By_SuperNeighborhood.shp
- Type "Census_2010_By_SuperNeighborhood" into the Output Feature Class bar.
- Click Run.
- In the Catalog pane, expand the CEVE101.gdb. There are now three feature classes contained within: Major_Rivers, SuperNeighborhood, Wastewater_Outfalls

- Right-click on the Downloads folder. Select Remove.
Adding Data to a Map
- In the Catalog pane on the right, right-click the Census_2010_By_SuperNeighborhood feature class and select Add To Current Map.
- An alternative method of adding data to a map is to click and hold the Major_Rivers feature class and drag and drop it into the Wastewater Outfalls map view.
- Repeat either method to add Wastewater_Outfalls to the map view.
Symbolizing Layers with a Single Symbol
It is early in the project to be deciding upon symbology, however, when layers are added to a map, ArcGIS Pro assigns then a random color symbol. Sometimes the colors are very faint and difficult to see on top of the basemap or the colors of multiple layers are very similar to each other and difficult to distinguish. To ensure that everyone can easily see the layers we are working with, we will adjust the basic symbology.
- In the Contents pane, right-click the Major_Rivers layer name and select Symbology to open the Symbology pane on the right.
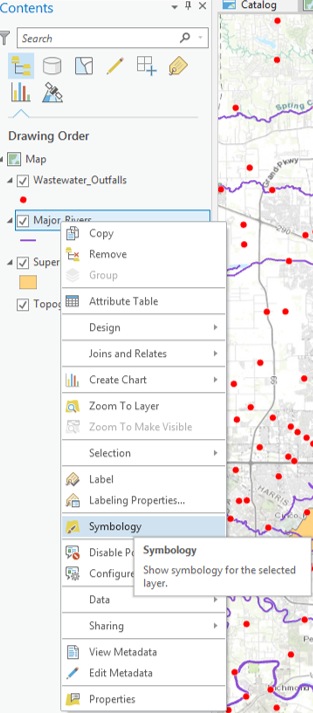
Notice that the 'Primary symbology' defaults to Single Symbol. With this type of symbology, all features in that particular layer will be assigned the same symbol.
- For 'Symbol', click the colored line symbol to switch to Format Line Symbol mode.

- Within Format Line Symbol mode, click the Properties tab.
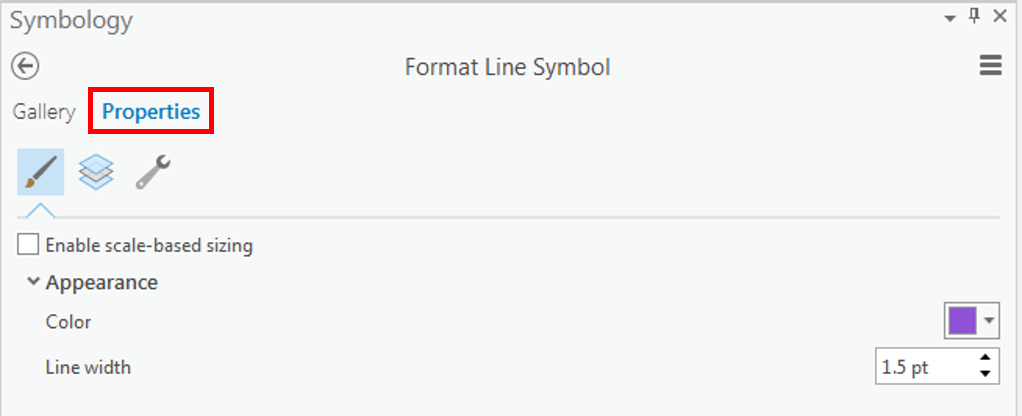
- For 'Color', use the drop-down menu to select Cretan Blue.
- At the bottom of the Symbology pane, click Apply.
The rivers on the map should now all be blue and easily visible on top of the basemap. The Format Symbol mode of the Symbology tab can be accessed directly via the layer symbol (instead of the layer name) in the Contents pane.
- In the Contents pane on the left, click the colored rectangle symbol beneath the Census_2010_By_SuperNeighborhood layer name.
- On the right in the Symbology pane, for 'Color', use the drop-down menu to select Mango.
- For 'Outline color', use the drop-down menu to select Gray 50%.
- At the bottom of the Symbology pane, click Apply.
- In the Contents pane on the right, right-click the colored point symbol beneath Wastewater_Outfalls layer name. Select Mars Red.

The super neighborhood polygons are now easy to distinguish from both the basemap and the rivers, while the wastewater outfalls are highly visible in red.

Navigating the Project
Navigating the Contents Pane
At the top of the Contents pane, there is a series of seven buttons. By default, the leftmost button is selected: List by Drawing Order.
When this button is selected, the order in which the layers are listed corresponds to the order in which the layers are visually stacked in the Map view. To test how the drawing order works, you will reorder the layers.
- In the Contents pane, click and hold the Census_2010_By_SuperNeighborhood layer name and drag and drop it above the Major_Rivers layer.
You will notice that, in the Map view, the Census_2010_By_SuperNeighborhood layer is now drawn in on top of the Major_Rivers layer, meaning that rivers are only visible in areas not covered by a super neighborhood. It is possible to add transparency to the super neighborhood layer or to symbolize it with a bold outline and a hollow fill, but, in general, it is best to have polygon layers at the bottom of the drawing order, so we will return the layers to their previous order.
- In the Contents pane, click and hold the Census_2010_By_SuperNeighborhood layer name and drag and drop it beneath the Major_Rivers layer, but above the Topographic basemap.
| Note |
|---|
Because the basemap is a solid image, any layers beneath it will not be shown at all, so ensure the basemap is always at the bottom of the layers in the Content pane. |
The check boxes to the left of each layer name toggle the visibility of each layer.
- Uncheck the Major_Rivers layer to turn off its visibility in the map view.
- Check the Major_Rivers layer to turn its visibility back on in the map view.
Navigating the Map View
You will now learn how to navigate the Map view by panning, zooming, and using spatial bookmarks.
- On the ribbon, click the Map tab.
- in the Navigate group, ensure that the Explore button is selected by default.
To pan the map:
- Within the map view, click and hold the left mouse button and drag the mouse and release.
To manually zoom:
- Hover your cursor over the area you wish to zoom in to and push the center scroll wheel away from you for incremental zooming. Pull the center scroll wheel towards you to zoom out.
-OR-
- Hover your cursor over the area you wish to zoom in to, hold down the right mouse button, and drag the mouse down for smooth zooming. Drag the mouse up to zoom out.
-OR-
- Hold down Shift such that your cursor changes to a magnifying glass and then click and hold and drag a box around the targeted area of interest to zoom directly to a specific extent.
To zoom to the extent of a particular layer:
- In the Contents pane, right-click the Census_2010_By_SuperNeighborhood layer name and select Zoom To Layer.
A spatial bookmark allows you to quickly return to a particular zoom extent in your Map view.
- On the Map tab, in the the Navigate group, click the Bookmarks button and select New Bookmark....
- In the 'Create Bookmark' window, for 'Name:', type "Houston" and click OK.
- To test the bookmark, use panning and zooming to change the extent of the map.
- Again, click the Bookmarks button and this time select the Houston bookmark to return to that extent.
...
| Note |
|---|
The following steps are to be completed on your own. You may use your personal computer (request software by e-mailing gisdata@rice.edu), visit the GDC lab M-F, 9-6PM, or use any of the Fondren Library 1st Floor Rice Computers. To begin where we left off in class, follow the instructions below to download the CEVE101 ArcGIS Pro Project. |
Download tutorial data to complete assignment here
If you are completing this tutorial from a personal computer, you will need to download the tutorial data online by following the instructions below:
- Click the following link to download the tutorial data: CEVE101.zip
- Unzip the CEVE101 folder.
- Copy the unzipped CEVE101 folder to your Desktop or another location of your choice. Ensure that you note the file path of the location you have selected.
Any time throughout the tutorial that you see reference to the file path C:\Users\gistrain\Desktop\IntroTutorialData, you will need to substitute it with the file path you have just selected.
The following step-by-step instructions and screenshots are based on the Windows 7 operating system with the Windows Classic desktop theme and ArcGIS Pro 2.1.3 software with an Advanced license. If your personal system configuration varies, you may experience minor differences from the instructions and screenshots
...
HCAD
Though it is not used in this course, the Harris County Appraisal District (HCAD) Public Data is another great online source that provides similar data such as highways, utilities, and water districts and is available at: http://pdata.hcad.org/GIS/index.html
Preparing the Downloaded Data for ArcGIS Pro
Once you have downloaded the Super Neighborhoods from COHGIS and the Wastewater Outfalls and Major Rivers from H-GAC, you will be able to find the data files in your Downloads folder. All of the files are zipped, meaning they contain compressed files of data within them (you can tell a file is zipped when the file type column reads “Compressed (zipped) Folder”). You will need to unzip the folders to be able to see the data inside them. To do that:
- Using File Explorer, open the Downloads folder.
- Ensure that you see the following zipped folders in your Downloads folder.
- Census_2010_By_SuperNeighborhood
- Major_Rivers
- Wastewater_Outfalls
- Select all three folders.
- Right-click any of the selected folders and select 7-Zip > Extract here.
Your data is in a file folder in its decompressed format and ready to be brought into ArcGIS Pro.
Creating a New Project in ArcGIS Pro
...
Creating a New Map
A map is a project item used to display and work with geographic data in two dimensions. The first step to visualizing any data is creating a new map.
...
You will notice that a new map view opens in the main section of ArcGIS Pro.
The panel on the left side of ArcGIS Pro is called the Contents pane. After creating a new map, the Contents pane now displays the default Map title and automatically adds the Topographic basemap layer to the map.
The panel on the right side of ArcGIS Pro is called the Catalog pane. After creating the first map, a new Maps section has been added to the top of the Project tab within the Catalog pane.
...
Notice that there is a single map there, named "Map". Since most projects will have multiple maps, it is a good idea to name your maps with more descriptive titles.
- In the Catalog pane, under the Maps section, right-click Map and select Rename.
- Type "Houston Outfalls" and hit Enter.
Saving a Project
Any time you create a new project item, such as a map or a layout, or any time you spend time adjusting the symbology of your map layers, it is a good idea to save your project.
...
Managing GIS Data
...
Adding Data to a Map
- In the Catalog pane on the right, right-click the Census_2010_By_SuperNeighborhood feature class and select Add To Current Map.
- An alternative method of adding data to a map is to click and hold the Major_Rivers feature class and drag and drop it into the Wastewater Outfalls map view.
- Repeat either method to add Wastewater_Outfalls to the map view.
Symbolizing Layers with a Single Symbol
It is early in the project to be deciding upon symbology, however, when layers are added to a map, ArcGIS Pro assigns then a random color symbol. Sometimes the colors are very faint and difficult to see on top of the basemap or the colors of multiple layers are very similar to each other and difficult to distinguish. To ensure that everyone can easily see the layers we are working with, we will adjust the basic symbology.
...
Notice that the 'Primary symbology' defaults to Single Symbol. With this type of symbology, all features in that particular layer will be assigned the same symbol.
...
The rivers on the map should now all be blue and easily visible on top of the basemap. The Format Symbol mode of the Symbology tab can be accessed directly via the layer symbol (instead of the layer name) in the Contents pane.
...
The super neighborhood polygons are now easy to distinguish from both the basemap and the rivers, while the wastewater outfalls are highly visible in red.
Navigating the Project
Navigating the Contents Pane
At the top of the Contents pane, there is a series of seven buttons. By default, the leftmost button is selected: List by Drawing Order.
When this button is selected, the order in which the layers are listed corresponds to the order in which the layers are visually stacked in the Map view. To test how the drawing order works, you will reorder the layers.
- In the Contents pane, click and hold the Census_2010_By_SuperNeighborhood layer name and drag and drop it above the Major_Rivers layer.
You will notice that, in the Map view, the Census_2010_By_SuperNeighborhood layer is now drawn in on top of the Major_Rivers layer, meaning that rivers are only visible in areas not covered by a super neighborhood. It is possible to add transparency to the super neighborhood layer or to symbolize it with a bold outline and a hollow fill, but, in general, it is best to have polygon layers at the bottom of the drawing order, so we will return the layers to their previous order.
- In the Contents pane, click and hold the Census_2010_By_SuperNeighborhood layer name and drag and drop it beneath the Major_Rivers layer, but above the Topographic basemap.
| Note |
|---|
Because the basemap is a solid image, any layers beneath it will not be shown at all, so ensure the basemap is always at the bottom of the layers in the Content pane. |
The check boxes to the left of each layer name toggle the visibility of each layer.
- Uncheck the Major_Rivers layer to turn off its visibility in the map view.
- Check the Major_Rivers layer to turn its visibility back on in the map view.
Navigating the Map View
You will now learn how to navigate the Map view by panning, zooming, and using spatial bookmarks.
- On the ribbon, click the Map tab.
- in the Navigate group, ensure that the Explore button is selected by default.
To pan the map:
- Within the map view, click and hold the left mouse button and drag the mouse and release.
To manually zoom:
- Hover your cursor over the area you wish to zoom in to and push the center scroll wheel away from you for incremental zooming. Pull the center scroll wheel towards you to zoom out.
-OR-
- Hover your cursor over the area you wish to zoom in to, hold down the right mouse button, and drag the mouse down for smooth zooming. Drag the mouse up to zoom out.
-OR-
- Hold down Shift such that your cursor changes to a magnifying glass and then click and hold and drag a box around the targeted area of interest to zoom directly to a specific extent.
To zoom to the extent of a particular layer:
- In the Contents pane, right-click the Census_2010_By_SuperNeighborhood layer name and select Zoom To Layer.
A spatial bookmark allows you to quickly return to a particular zoom extent in your Map view.
...
.
Exploring Data in the Map View
...