...
| Info |
|---|
This guide was created by the staff of the GIS/Data Center at Rice University and is to be used for individual educational purposes only. The steps outlined in this guide require access to ArcGIS Pro software and data that is available both online and at Fondren Library. The following text styles are used throughout the guide: Explanatory text appears in a regular font.
Folder and file names are in italics. Names of Programs, Windows, Panes, Views, or Buttons are Capitalized. 'Names of windows or entry fields are in single quotation marks.' "Text to be typed appears in double quotation marks." |
Obtaining the Tutorial Data
There are three ways of obtaining the tutorial data. The best option for getting the full GIS project experience is to follow Option 1 and learn how to download and prepare data from online GIS data portals independently. You will also gain exposure to the best GIS data websites for the Houston region.
...
Before beginning the tutorial, you will copy all of the required tutorial data onto your Desktop. Follow the applicable set of instructions below depending on the particular computer you are using.
OPTION 1: Obtaining tutorial data independently online
If you would like to download and prepare the data for this tutorial from scratch, follow the instructions below:
...
At the end of the tutorial, you will have an Intro folder on the Desktop containing all of the required files.
OPTION 2: Accessing tutorial data from Fondren Library using the gistrain profile
If you are completing this tutorial from a public computer in Fondren Library and are logged on using the gistrain profile, follow the instructions below:
- On the Desktop, double-click the Computer icon > gisdata (\\file-rnas.rice.edu) (R:) > Short_Courses > Introduction_to_GIS.
- To create a personal copy of the tutorial data, drag the Intro folder onto the Desktop.
- Close all windows.
OPTION 3: Accessing tutorial data online using a personal computer
If you are completing this tutorial from a personal computer, you will need to download the tutorial data online by following the instructions below:
...
| Info |
|---|
The following step-by-step instructions and screenshots are based on the Windows 7 operating system with the Windows Classic desktop theme and ArcGIS Pro 2.1.3 software. If your personal system configuration varies, you may experience minor differences from the instructions and screenshots. |
Getting Started with ArcGIS Pro
Managing Projects
Opening an Existing Project
- On the Desktop, double-click your Intro folder to open it.
- Double-click the Intro.aprx file to open the existing project in ArcGIS Pro.
Creating a New Map
A map is a project item used to display and work with geographic data in two dimensions. The first step to visualizing any data is creating a new map.
...
- In the Catalog pane, under the Maps section, right-click Map and select Rename.
- Type "Super Neighborhoods" and hit Enter.
Saving a Project
Any time you create a new project item, such as a map or a layout, or any time you spend time adjusting the symbology of your map layers, it is a good idea to save your project.
- Above the ribbon, on the Quick Access toolbar, click the Save button.
Managing Maps
Browsing Existing Data
As a reminder, in the Intro to GIS Data Management tutorial, we imported the feature classes of interest into our project geodatabase.
- In the Catalog pane, click the arrow to expand the Databases section.
- Click the arrow to expand the Intro.gdb geodatabase.
Adding Data to a Map
- Right-click the Census_2010_By_SuperNeighborhood feature class and select Add To Current Map.
- An alternative method of adding data to a map is to click and hold the Major_Roads feature class and drag and drop it into the Super Neighborhoods map view.
Symbolizing Layers with a Single Symbol
It is early in the project to be deciding upon symbology, however, when layers are added to a map, ArcGIS Pro assigns then a random color symbol. Sometimes the colors are very faint and difficult to see on top of the basemap or the colors of multiple layers are very similar to each other and difficult to distinguish. To ensure that everyone can easily see the layers we are working with, we will adjust the basic symbology.
...
The super neighborhood polygons are now easy to distinguish from both the basemap and the freeways. In addition, the borders of the super neighborhoods are clear and easy to differentiate from the freeways.
Navigating the Project
Navigating the Contents Pane
At the top of the Contents pane, there is a series of seven buttons. By default, the leftmost button is selected: List by Drawing Order.
...
- Uncheck the Major_Roads layer to turn off its visibility in the map view.
- Check the Major_Roads layer to turn its visibility back on in the map view.
Navigating the Map View
You will now learn how to navigate the Map view by panning, zooming, and using spatial bookmarks.
...
- On the Map tab, in the the Navigate group, click the Bookmarks button and select New Bookmark....
- In the 'Create Bookmark' window, for 'Name:', type "Houston" and click OK.
- To test the bookmark, use panning and zooming to change the extent of the map.
- Again, click the Bookmarks button and this time select the Houston bookmark to return to that extent.
...
Exploring Data in the Map View
Selecting Features Manually
Selecting Features Manually from the Map View
- On the Map tab, in the Selection group, click the Select button.
- In the map view, click on any neighborhood to select it.
...
- On the Map tab, in the Navigate group, click the Explore button.
Selecting Features Manually from the Table View
- In the Contents pane, right-click the Census_2010_By_SuperNeighborhood layer name and select Attribute Table.
...
- At the top of the Census_2010_By_SuperNeighbrhood table view, click the Clear button.

- Close the attribute table.

Symbolizing Layers By Attributes
Symbolizing Layers By Quantity
- In the Contents pane, right-click the Census_2010_By_SuperNeighborhood layer name and select Symbology.
- Use the primary 'Symbology' drop-down menu to select Graduated Colors.
- Use the 'Field' drop-down menu to scroll down sixth from the bottom and select the SUM_Vacant field. This field stores the number of vacant housing units within each neighborhood.
...
----------------------------------------------------------------------
Adding Layer Transparency
- Ensure that the Census_2010_By_SuperNeighborhood layer is selected.
- In the ribbon, click the Feature Layer contextual Appearance tab.
- In the Effects group, slide the Layer Transparency slider or type "50" and hit Enter.
Symbolizing Layers By Category
- Use the primary 'Symbology' drop-down menu to select Unique Values.
- Use the 'Field 1' drop-down menu to select Name.
- In the Contents pane, collapse the Census_2010_By_Superneighborhood symbology.
...
----------------------------------------------------------------------
Selecting Features Programatically
Selecting Features By Attributes
- In the ribbon, click the Map tab.
- In the Selection group, click the Select By Attributes button to open the Select Layer By Attribute tool in the Geoprocessing pane.
- In the Geoprocessing pane, click the Add Clause button.
- Use the drop-down menus to build the following expression: Name is Equal to 'YOUR_NEIGHBORHOOD_NAME' and click the Add button.
- Ensure your Geoprocessing pane appears similar to that below and click Run.
Exporting Selected Features
- In the Contents pane, right-click the Census_2010_By_SuperNeighborhood layer name and select Data > Export Features.
- In the Geoprocessing pane, click the 'Output Feature Class' field to edit the name. Replace Census_2010_By_SuperNeighbor with "MyNeighborhood". Ensure that you leave everything in the file path through Intro.gdb\.
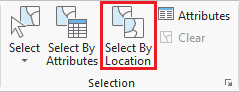
Selecting Features By Location
Now we will create a map of the bus stops and bus routes within your neighborhood. We could continue to do our mapping within the existing map, but, since we are now focusing on different thematic layers in a different geographic extent, this could be a good time to create a second map within our project.
...
- In the Selection group, click the Select By Location button to open the Select Layer By Attribute tool in the Geoprocessing pane. Select bus stops within neighborhood.
- Select bus routes within 100 ft of bus stop in neighborhood.
...
Presenting and Sharing Maps
Creating a Layout
Once you are finished with your analysis, you may want to create a map that is suitable for adding to a report, presentation, or sharing with others who don't have access to ArcGIS software.
...
More tips for creating a layout are covered in the Map Layouts for Publication short course.
Exporting a Layout
- On the ribbon, click the Share tab.
- Click the Export Layout button.
- On the left, click the Desktop folder.
- Double-click the Intro folder.
...