...
- In the Contents pane on the left, click the colored rectangle symbol beneath the COH_HISTORIC_DISTRICTS layer name.

- For 'Color', use the drop-down menu to select Mango.

- For 'Outline color', use the drop-down menu to select Gray 50%.
- At the bottom of the Symbology pane, click Apply.
- Repeat either of the above two methods to change the symbology of COH_HISTORIC_SITESLANDMARKS to: 'Color' = Burnt Umber and 'Size' = 5.
- Your three layers should now look like the below image.

Navigating the Project
...
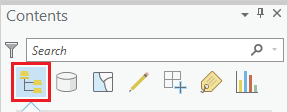
At the top of the Contents pane, there is a series of seven buttons. By default, the leftmost button is selected: 'List by Drawing Order'.
When this button is selected, the order in which the layers are listed corresponds to the order in which the layers are visually stacked in the Map viewView. To test how the drawing order works, you will reorder the layers.
...
You will notice that, in the Map viewView, the COH_HISTORIC_DISTRICTS layer is now drawn in on top of the COH_HISTORIC_SITESLANDMARKS layer, meaning that historic sites are only visible in areas not covered by a historic district. It is possible to add transparency to the historic district layer or to symbolize it with a bold outline and a hollow fill, but, in general, it is best to have polygon layers at the bottom of the drawing order, so we will return the layers to their previous order.
...
You will now learn how to navigate the Map view View by panning, zooming, and using spatial bookmarks.
...
- In the Contents pane, right-click the COH_HISTORIC_SITESLANDMARKSDISTRICTS layer name and select Zoom To Layer.
...
- Drag a box to select multiple historic districts. This will also select any historic sites/landmarks your box intersects.
- Hold down Shift and click any non-selected historic district to add additional non-adjacent historic districts to the selection.
- Hold down Ctrl and click any selected historic district to deselect.
...
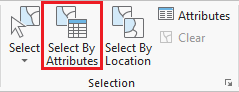
- In the ribbon, click the Map tab.
- In the Selection group, click the Select By Attributes button to open the Select Layer By Attribute tool in the Geoprocessing pane.
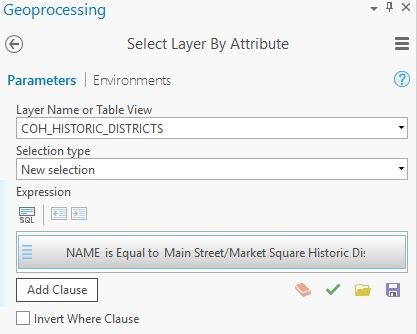
- In the Geoprocessing pane, ensure the COH_HISTORIC_DISTRICTS layers is selected in the 'Layer Name or Table View' input.
- Click the Add Clause button.
- Use the drop-down menus to build the following expression: NAME is Equal to 'Main Street/Market Square Historic District' and click the Add button.
- Ensure your Geoprocessing pane appears similar identical to that below and click Run.
 You will see that one historic district, named "Main Street/Market Square Historic District" is now selected.
 - On the On the the Map tab, in the Selection group, click the Clear button to clear the selected features.
...
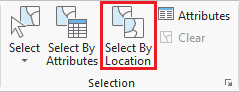
- In the Selection group, click the Select By Location button to open the Select Layer By Attribute tool in the Geoprocessing pane.
Select features from COH_HISTORIC_DISTRICTS that intersect Major_Rivers. Ensure your Geoprocessing pane appears similar identical to that below and click Run.

Exporting Selected Features
To create a new layer with just our historic district of interest we need to export this selected feature.
- In the Contents pane, right-click the COH_HISTORIC_DISTRICTS layer name and select Data > Export Features.
- In the Geoprocessing pane, click the 'Output Feature Class' field to edit the name. Replace Replace COH_HISTORIC_DISTRICTS_CopyF with "MainStreet_MarketSquare". Ensure that you leave everything in the file path through Intro_Part1.gdb\.
On the the Map tab, in the Selection group, click the Clear button to clear the selected features.
Now we will create a map of the historic district at risk of flooding due to proximity of a river. We could continue to do our mapping within the existing map, but, since we are now focusing on different thematic layers in a different geographic extent, this could be a good time to create a second map within our project.
- Select features from COH_HISTORIC_SITESLANDMARKS that intersect MainStreet_MarketSquare. Ensure your Geoprocessing pane appears similar to that below and click Run.

- In the Contents pane, right-click the COH_HISTORIC_SITESLANDMARKS layer name and select Data > Export Features.
- In the Geoprocessing pane, click the 'Output Feature Class' field to edit the name. Replace
- On the ribbon, click the Insert tab.
- In the Project group, click the New Map button.
- At the bottom of the Geoprocessing pane, click the Catalog pane tab.
- Rename the new map "Historic District Flood Risk" and add COH_HISTORIC_SITESLANDMARKS, MainStreet_MarketSquare and Major_Rivers to this map.Select features from COH_HISTORIC_SITESLANDMARKS that intersect MainStreet_MarketSquare. Ensure your Geoprocessing pane appears similar to that below and click Run._CopyF with "Historic_Sites_At_Risk". Ensure that you leave everything in the file path through Intro_Part1.gdb\.
On the the Map tab, in the Selection group, click the Clear button to clear the selected features.
Presenting and Sharing Maps
Creating a New Map
Now we will create a map of the historic district at risk of flooding due to proximity of a river. We could continue to do our mapping within the existing map, but, since we are now focusing on different thematic layers in a different geographic extent, this could be a good time to create a second map within our project.
- On the ribbon, click the Insert tab.
- In the Project group, click the New Map button.
- At the bottom of the Geoprocessing pane, click the Catalog pane tab.
- Rename the new map "Historic District Flood Risk" and add Historic_Sites_At_Risk, MainStreet_MarketSquare and Major_Rivers to this map.
- Update the symbology for the
- In the Contents pane, right-click the COH_HISTORIC_SITESLANDMARKS layer name and select Data > Export Features.
- In the Geoprocessing pane, click the 'Output Feature Class' field to edit the name. Replace COH_HISTORIC_SITESLANDMARKS_CopyF with "Historic_Sites_At_Risk". Ensure that you leave everything in the file path through Intro_Part1.gdb\.
On the the Map tab, in the Selection group, click the Clear button to clear the selected features.
- In the Contents pane, rick-click on COH_HISTORIC_SITESLANDMARKS and select Remove.
- Update the symbology for the Major_Rivers, MainStreet_MarketSquare, and Historic_Sites_At_Risk, MainStreet_MarketSquare and Major_Rivers layers as desired.
...
Creating a Layout
Once you are finished with your analysis, you may want to create a map that is suitable for adding to a report, presentation, or sharing with others who don't have access to ArcGIS software.
...