...
You will notice that a new map Map view opens in the main section of ArcGIS Pro.
...
- Right-click the COH_HISTORIC_DISTRICTS feature class and select Add To Current Map.
- An alternative method of adding data to a map is to click and hold the Major_Rivers feature class and drag and drop it into the Houston History map view Map view.
- Repeat either of the above two methods to add COH_HISTORIC_SITESLANDMARKS to the Houston History map Map view.
- Above the ribbon, on the Quick Access toolbar, click the Save button.
...
When this button is selected, the order in which the layers are listed corresponds to the order in which the layers are visually stacked in the Map Viewview. To test how the drawing order works, you will reorder the layers.
...
You will notice that, in the Map Viewview, the COH_HISTORIC_DISTRICTS layer is now drawn in on top of the COH_HISTORIC_SITESLANDMARKS layer, meaning that historic sites are only visible in areas not covered by a historic district. It is possible to add transparency to the historic district layer or to symbolize it with a bold outline and a hollow fill, but, in general, it is best to have polygon layers at the bottom of the drawing order, so we will return the layers to their previous order.
...
- Uncheck the Major_Rivers layer to turn off its visibility in the map Map view.
- Check the Major_Rivers layer to turn its visibility back on in the map Map view.
Navigating the Map
...
view
You will now learn how to navigate the Map View view by panning, zooming, and using spatial bookmarks.
...
To pan the map:
- Within the map Map view, click and hold the left mouse button and drag the mouse and release.
...
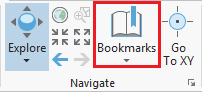
- On the Map tab, in the the Navigate group, click the Bookmarks button and select New Bookmark....
- In the 'Create Bookmark' window, for 'Name:', type "Houston Historic Districts" and click OK.
- To test the bookmark, use panning and zooming to change the extent of the map.
- Again, click the Bookmarks button and this time select the Houston Historic Districts bookmark to return to that extent.
...
Exploring Data in the Map
...
view
Selecting Features Manually
Selecting Features Manually from the Map
...
view
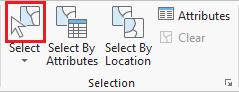
- On the Map tab, in the Selection group, click the Select button.
- In the map Map view, click on any historic district to select it.
...
A table view now appears docked beneath your map Map view. Each row, or record, in your table corresponds to exactly one historic district polygon on the map. Each column, or field, in your table represents a variable describing the historic districts.
...
- On the ribbon, click the Insert tab.
- In the Project group, click the New Layout button.
- At the bottom of the options panel, select Letter 8.5" x 11" at the top left. A new tab will open in your Map Viewview, called Layout.
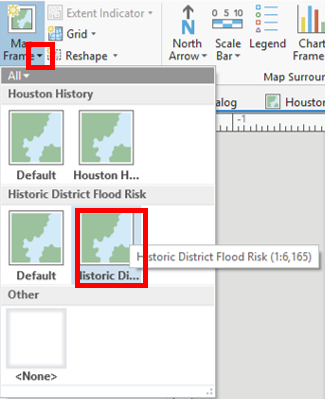
- From the Insert tab, in the Map Frames group, click the drop down arrow on the Map Frame icon and choose the Historic District Flood Risk map frame.
- Above the ribbon, on the Quick Access toolbar, click the Save button.
...