...
For this tutorial, we are working with vector data which is a spatial data format that uses points, lines, and polygons to represent real features on the earthEarth's surface. Vector data is ideal for discrete themes with definite boundaries. A Feature Class is a vector storage format that represents a homogeneous collection of common features. There are two types of Feature Classes: a Shapefile feature class and a Geodatabase feature class. A Shapefile feature class is an open source format. Its file extension is .shp and its icon is green. A Geodatabase feature class is an Esri proprietary format. A Geodatabase feature class must be stored inside a Geodatabase (.gdb) and its icon is white. To better organize our project, we will import data into our Project Geodatabase.
- In the Catalog pane, click the US_tract_1980_Harris_County geodatabase feature class located in the NHGIS folder and drag-and-drop it into the Intro_Part2.gdb. A progress bar will appear that reads 'Copying...' Once it is complete, you will see a copy of US_tract_1980_Harris_County inside the Intro_Part2.gdb as shown below.

- Repeat the above step to drag-and-drop Major_Rivers from the Major_Rivers.gdb into the Intro_Part2.gdb.
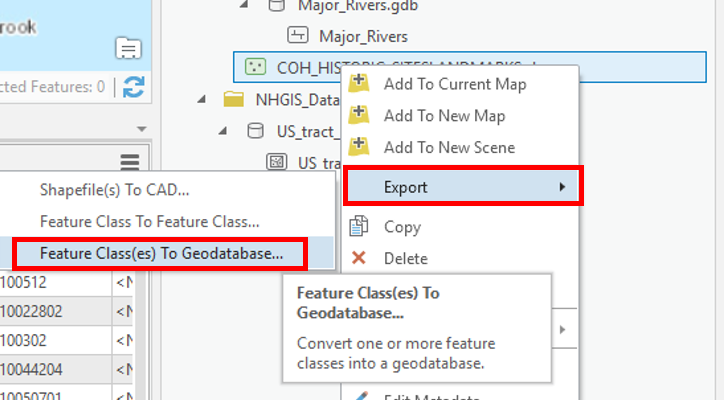
- COH_HISTORIC_SITESLANDMARKS is a Shapefile feature class, so it requires a different method to be imported into the Project Geodatabase. In the Catalog pane, right-click on COH_HISTORIC_SITESLANDMARKS.shp and select Export > Feature class(es) to geodatabase.
- In the Geoprocessing pane, accept default settings as shown below and click Run.

- In the Catalog pane, right-click on Intro_Part2.gdb and select Refresh.

- Your Project Geodatabase should now contain three Geodatabase feature classes: COH_HISTORIC_SITESLANDMARKS, Major_Rivers, and US_tract_1980_Harris_County.

- In the Catalog pane, in the Folders section, right-click on Downloads and select Remove.

- Repeat Step 7 to remove the connection to the 'NHGIS_Data' folder.
Bonus: Symbolizing Layers By Attributes
...
- In the Contents pane, right-click the US_tract_1980_Harris_County layer name and select Symbology.
- In the Symbology pane, click the primary drop-down menu and select Graduated Colors.

- Use the 'Field' drop-down menu to select the AV0AA1980 field. NHGIS data downloads include a read-me file that defines the codes for each field (column). AV0AA1980 stores the number of people within each census tract for the year 1980.
The Map view now displays a choropleth map, where the darker colors represent higher numbers of people. In studying the map, it appears as if there is no discernible pattern to population numbers. While this is true according to raw counts per census tract, there could be differences in the census tracts that are unaccounted for in this symbology. Now you will try normalizing by the area of the census tracts. - Use the 'Normalization' drop-down menu to scroll to the bottom and select the last Shape_Area field.
Note: the
The projection of the census layer is GCS WGS 1984. Therefore, the layer is unprojected and the coordinates are stored in angular units of decimal degrees. Therefore, the Shape_Area field is displaying square decimal degrees and the map is displaying number of people per square decimal degree. This is a somewhat incomprehensible unit, however, the values are still proportional to how they would be in a different unit and the relative coloring on the map remains correct. Notice that according to the density of population count, the greatest amount of people appear to be inside the major loops. - On the lower half of the Symbology pane, click the Histogram tab.

- Use the 'Method" drop-down menu to select Equal Interval.
- Use the 'Method" drop-down menu to select Quantile.
- Use the 'Classes' drop-down menu to select 20.
- Use the 'Classes' drop-down menu to select 2.
- Use the 'Color Scheme' drop-down menu to select a different color scheme of your choice.
...
- In the Contents pane, ensure that the US_tract_1980_Harris_County layer is selected.
- In the ribbon, click the Appearance tab.
- In the Effects group, slide the Layer Transparency slider or type "50" and hit Enter.
- Return the Layer Transparency slider to "0".
...