TABLE OF CONTENTS
| Table of Contents |
|---|
| Info |
|---|
This guide was created by the staff of the GIS/Data Center at Rice University and is to be used for individual educational purposes only. The steps outlined in this guide require access to ArcGIS Pro software and data that is available both online and at Fondren Library. |
| Table of Contents |
|---|
The following text styles are used throughout the guide: Explanatory text appears in a regular font.
Folder and file names are in italics. Names of Programs, Windows, Panes, Views, or Buttons are Capitalized. 'Names of windows or entry fields are in single quotation marks.' "Text to be typed appears in double quotation marks." |
The following step-by-step instructions and screenshots are based on the Windows 7 10 operating system with the Windows Classic desktop theme and ArcGIS Pro 2.1.3 software. If your personal system configuration varies, you may experience minor differences from the instructions and screenshots. |
Obtaining the Tutorial Data
Before beginning the tutorial, you will copy all of the required tutorial data onto your Desktop. Option There are two ways of obtaining the tutorial data. Option 1 is best if you are completing this tutorial in one of our short courses or from the GIS/Data Center Fondren Library and Option 2 is best if you are completing the tutorial from your own computer.
...
If you are completing this tutorial from a public computer in Fondren Library and are logged on using the gistrain profile, follow the instructions below:
- On the the Desktop, double-click the Computer icon > gisdata (\\file-rnasclick the File Explorer icon
located on the Windows Taskbar at the bottom left corner of the screen.
- In the 'File Explorer' window, click This PC on left side panel and then navigate to GISData (\\smb.rdf.rice.edu\research\FondrenGDC) (
- O:)
- > GDCTraining > 1_Short_Courses
- > Mapping_Imagery.
- To create a personal copy of the tutorial data, drag the Imagery folder folder onto the the Desktop.
- Close all windows.
OPTION 2: Accessing tutorial data online using a personal computer
...
| Info | ||
|---|---|---|
| ||
- Click Imagery.zip above to download the tutorial data.
- Open the Downloads folder.
- Right-click Imagery.zip and select Extract All....
- In the 'Extract Compressed (Zipped) Folders' window, accept the default location into the Downloads folder and click Extract.
- Drag the unzipped Imagery folder onto your Desktop.
- Close all windows.
...
- On the Desktop, double-click the Imagery folder.
- Double-click the Imagery.aprx project file ArcGIS Project File (blue icon) to open the project in ArcGIS Pro.
- Maximize the the ArcGIS Pro application window.
...
- In the Catalog pane on the right, expand the Databases folder.
- Expand the Imagery.gdb geodatabase.
- Click the the first buildings feature feature class to select it.
- Hold down Shift and and click the the last streets feature feature class to select all four feature classes within the geodatabase.
- Right-click the streets feature class and select Add To New Map.
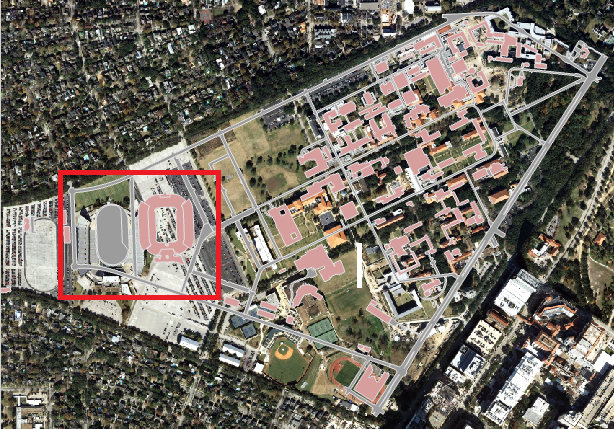
Ensure that all four feature classes (streets, sidewalks, parking, buildings) appear in the Contents pane on the left. If you are missing any layers, drag them from the Catalog pane on the right directly into the Map view. The layers of the Rice campus should look familiar. If If desired, update the symbology of each of the layers to a color of your choice by right-clicking on the color patch beneath each layer name in the Contents pane and selecting a color. For example, you might choose to make the the parking and and streets layers layers two different shades of gray, the the sidewalks layer layer tan, and the the buildings layer red, as shown below.

Now you will add a JPEG image depicting an aerial view of campus to your map. This image is just like any other image file you are familiar with and does not contain any sort of spatial reference.
- In the Catalog pane, expand the the Folders folder folder.
- Expand the the Imagery folder folder.
Right-click the the aerial.jpg raster raster image and and select Add to Current Map.
Info If the Add to Current Map command does not work, you can click the Add Data button within the Map tab on the ribbon and then browse to and select the same JPEG image file.
- In the Table of Contents pane, right-click the aerial.jpg layer and select Zoom to Layer.
- In the Table of Contents pane, right-click the the streets layer and layer and select Zoom to Layer.
Both layers appear in the data frame, but, as expected, the image cannot be lined up with the other data layers, because it has not been georeferenced and no projection has been defined.
...
Since the aerial photograph never had a coordinate system associated with it, you will need to georeference it based on the other campus layers using control points. Control points are recognizable points in both layers that occur in the same geographic location.
- On the ribbon, click the the Imagery tab tab.
- In the Contents pane, click the the aerial.jpg layer layer to select it. If it is not selected, then most options in the Imagery tab will be grayed out and unavailable.
- On the Georeference tab, click the the Georeference button button to open the Georeference tab.

...
- In the Contents pane on the left, right-click the the streets layer and layer and select Zoom to Layer.
- In the Georeferencing toolbar, click the the Fit to Display button button.
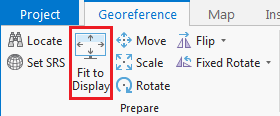
The full extent of the image now appears behind the current layers. It is always good to zoom in to the approximate extent of the image before using the Fit to Display command. Notice that while both layers are now visible, they are not yet perfectly aligned. If significant rotation or scaling was necessary to identify common control points, you would use the Move, Scale, and Rotate buttons on the Georeference tab at this point. Once control points have been added, these tools are no longer available.
You now need to identify a common point in both the aerial image and the vector reference layers.
- In the Table of Contents pane, uncheck the the parking and and sidewalks layers layers to make the aerial image easier to view.
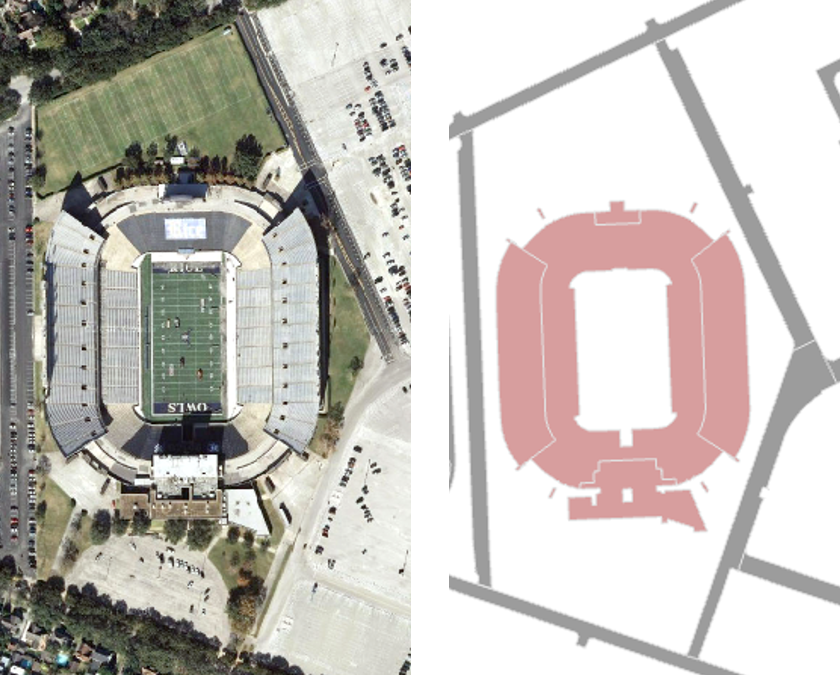
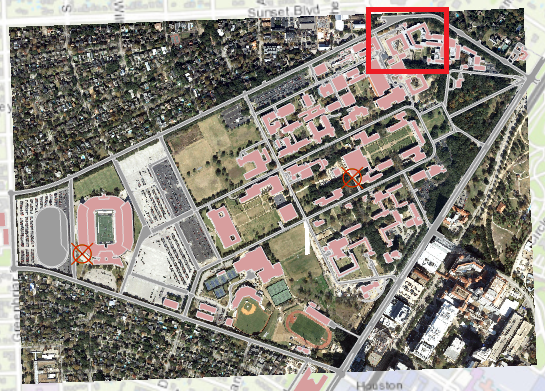
On the western portion of campus, visually identify the the football stadium in in both the the aerial layer layer and the the buildings layer layer.
Hold down Shift and and your cursor should switch from a pointer finger to a magnifying glass with a plus sign.
Info If you don't see the proper cursor, then you may need to select the Explore button on the Map tab in the ribbon.
- Click and drag a a box around the the football stadium in both layers to to zoom in to the area in which you will add your first control point.
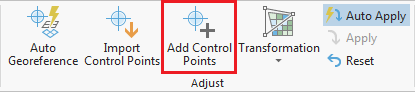
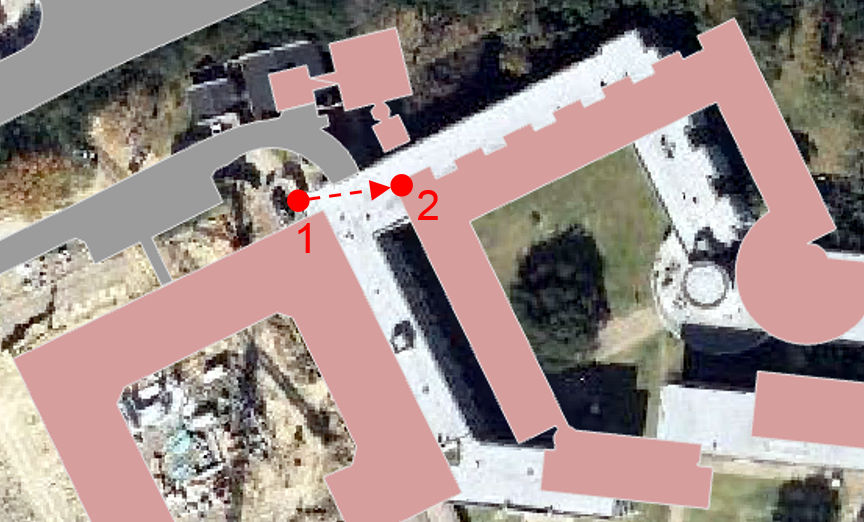
On the ribbon, on the Georeference tab, click the the Add Control Points button button. Your cursor will change to a crosshair.
Click on the on the southwest corner of the upper deck of the stadium in the in the aerial layer layer.
Info If your first click is on an unintended location, press Esc to remove the point. Then click the Add Control Points button again to resume adding a point.
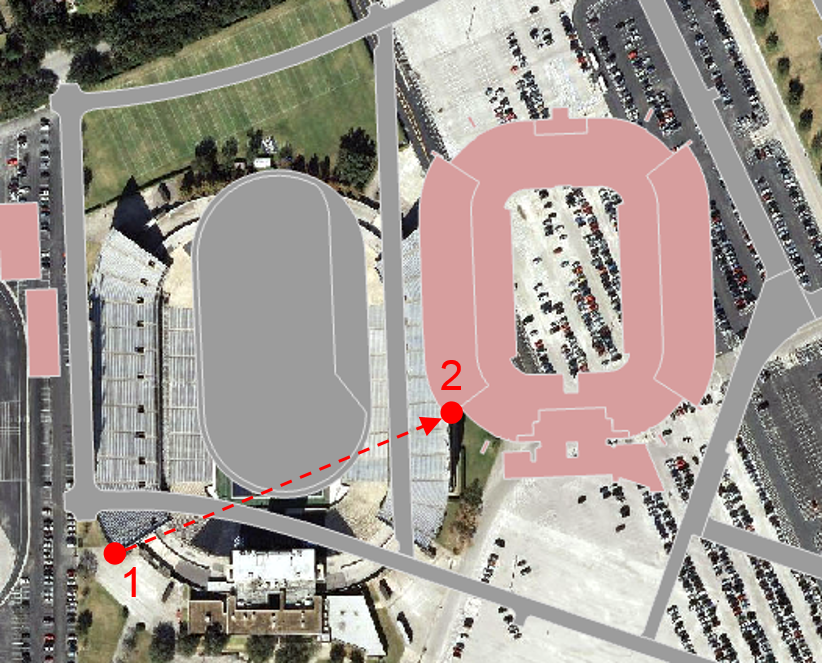
With a line linking to the first point you clicked on, click on the on the southwest corner of the upper deck of the stadium on the on the buildings layer layer.
Info It is fine to zoom in and out by scrolling the scroll wheel or to pan by clicking and holding your scroll wheel button while moving the mouse in between clicking on the two control points if they are not both visible on your screen.
If your second click is on an unintended location or you clicked on the two points in the opposite order, then, on the Georeference tab, in the Review group, click the Select Control Point button.

Then click on the erroneous control point on your map. The control point symbol will change from a larger red circle with an X through it to a smaller red box when it is selected. Once the control point is selected, go back to the Review group on the Georeference tab and click the Delete Selected Control Point button.
If you make a mistake on your first control point, so that removing the erroneous point results in removing all points, then the image will disappear from view and you will need to start again by zooming to the streets layer and the clicking the Fit to Display button. Click the Add Control Points button to resume adding a point.
The two points will snap together, lining up the image at that particular control point.
- In the Table of Contents pane, right-click the the streets layer and layer and select Zoom to Layer to to return to the full extent of the image.
At this point, the image is aligned at the one control point, but the scale of the image does not match the scale of the vector layers, so nothing else is yet aligned. You will need to select another control point to begin to establish the proper scale. Remember, it is best to select a point that is is not horizontally horizontally or vertically in line with the existing control point.
- In the center of campus, visually identify Fondren Library in in both the the aerial layer layer and the the buildings layer layer.

- In the ribbon, click the the Map tab and tab and click the the Explore button button.
- Hold down Shift and and click and drag a a box around around Fondren Library in both layers to to zoom into the area in which you will add your second control point. You may have to toggle off the buildings layer to see Fondren Library on the aerial layer.

- On the ribbon, click the the Georeference tab and tab and click the the Add Control Points button button.
- Click on the on the southwest corner of Fondren Library in the in the aerial layer layer.
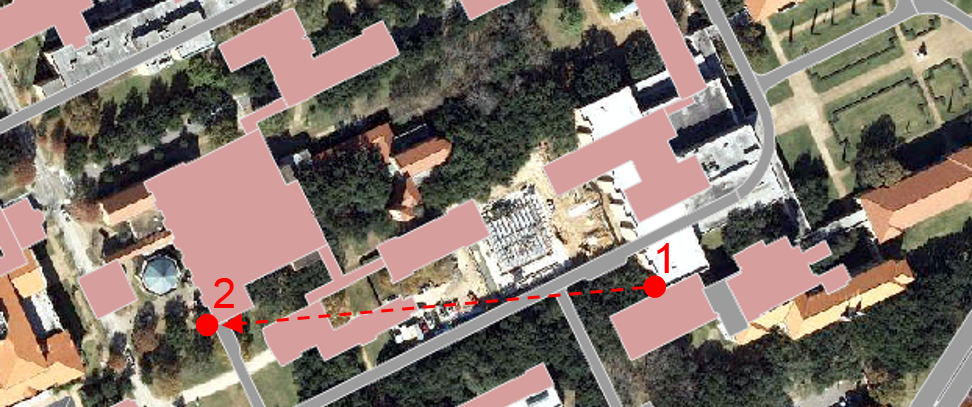
- With a line linking to the first point you clicked on, click on the the southwest corner Fondren Library in the the buildings layer layer.
The two points will snap together, lining up the image at that particular control point.
- In the Table of Contents, right-click the the streets layer and layer and select Zoom to Layer to to return to the full extent of the image.
...
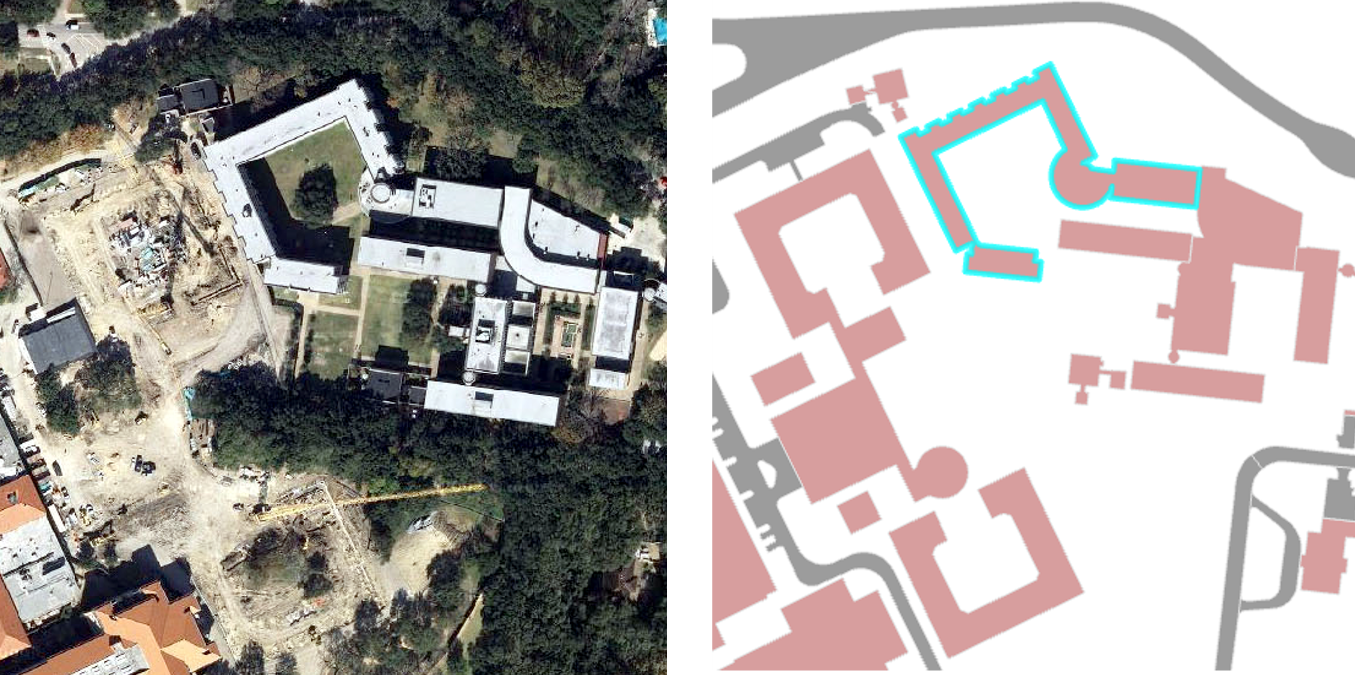
- In the northern-most portion of campus, visually identify Martel College in in both the the aerial layer layer and the the buildings layer layer.
- In the ribbon, click the Map tab and click the Explore button.
- Hold down Shift and click and drag a a box around around Martel College in in both layers to zoom into the area in which you will add your third control point.
- In the Georeferencing toolbar, click the the Add Control Points button button.
- Click on the on the northwest corner of Martel College in the in the aerial layer layer.
- With a line linking to the first point you clicked on, click on the on the northwest corner Martel College on the on the buildings layer layer.
- In the Table of Contents pane, right-click the the streets layer and layer and select Zoom to Layer to to return to the full extent of the image.
...
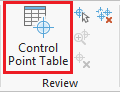
- In the ribbon, on the Georeference tab, click the the Control Point Table button button.
A new control point table for the the aerial.jpg layer layer will open.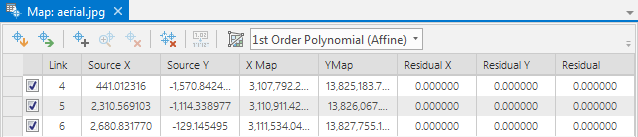
This table lists all the control points you have added. The residual, in the final column of the table, is a measure of how distorted the image has become. A lower residual indicates that the georeferenced image has less distortion from the original image. It not necessary to obtain a residual of zero, as this is difficult unless both layers are from the same source or were already in the same coordinate system.
If you added a poor or incorrect control point, you could select it in the table and click the Delete Selected button to remove it. You could also simply uncheck it, so that it is no longer factored in to georeferencing calculations. You would then want to continue adjusting your control points until you achieved the desired result.
- Close the the Map: aerial.jpg control control point table view.
Notice that none of the final three control points are in line with each other vertically or horizontally, the image appears to be well aligned, and the residual is at or close to 0. These are all indications that the georeferencing was successful.
- When you are satisfied with your control points, in the ribbon, on the Georeference tab, in the Save group, click the the Save button button.
- On the Georeference tab, click the the Close Georeference button button.

Notice that the control points have disappeared.
- Above the ribbon, on the Quick Access toolbar, click the Save button.
- Close ArcGIS Pro.
- On the Desktop, double-click the the Imagery folder.
Before beginning this tutorial, there was only one aerial file: aerial.jpg. During the tutorial, you generated the two additional files. The JGWX file contains the spatial referencing information that you just created. Because this new file has been created, the image will now line up spatially whenever you add it into a new data frame. In other words, you only need to georeference a layer once. The The XML file contains the metadata used by ArcCatalog to describe the newly georeferenced aerial image. If If you were to delete these two accessory files, the image would no longer be georeferenced and would be returned to its original state.