| Table of Contents |
|---|
| Info |
|---|
This guide was created by the staff of the GIS/Data Center at Rice University and is to be used for individual educational purposes only. The steps outlined in this guide require access to ArcGIS Pro software and data that is available both online and at Fondren Library. The following text styles are used throughout the guide: Explanatory text appears in a regular font.
Folder and file names are in italics. Names of Programs, Windows, Panes, Views, or Buttons are Capitalized. 'Names of windows or entry fields are in single quotation marks.' "Text to be typed appears in double quotation marks." |
...
| Info |
|---|
The following step-by-step instructions and screenshots are based on the Windows 10 operating system with the Windows Classic desktop theme and ArcGIS Pro 3.2.1.3 0 software. If your personal system configuration varies, you may experience minor differences from the instructions and screenshots. |
...
- On the Desktop, double-click the Computer icon > gisdata This PC > GISData (\\file-rnassmb.rdf.rice.edu\research\FondrenGDC) (RO:) > > GDCTraining > 1_Short_Courses > > Mapping_XY_Data.
- To create a personal copy of the tutorial data, drag the XY folder onto the Desktop.
- Close all windows.
...
This Excel worksheet provides a list of cities whose mayors signed the U.S. Conference of Mayors Climate Protection Agreement as of September 12, 2011. This list was obtained from the Climate Protection Center website at http://www.usmayors.org/climateprotection/list.asp. Notice that the worksheet also contains the latitude and longitude of the cities in decimal degrees.
- Close Excel.
...
Creating XY Data Feature Class
Now that you have examined the tabular data in Excel, it is time to display the XY data of city locations on a map.
...
- In the Catalog pane, right-click the Sheet1$ worksheet table and select Add To New Map.
- In the Contents pane on the left, right-click the Sheet1$ standalone table, hover over Create Points From Table, and selectDisplay XY DataTable to Point.
The Geoprocessing pane should open on the right in a new tab overlaying the Catalog pane. In the 'Make XY Event Layer' tool, notice that 'XY A new pop-up should appear titled XY Table To Point. Notice that 'Input Table' is already set to the the Sheet1$ table, since that was the table used to open the tool.
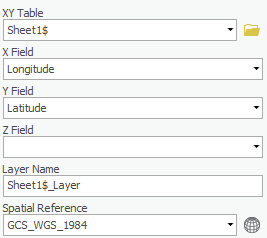
- For ‘Output Feature Class’, rename the feature class from Sheet1_Features_CopyFeatures to “ClimateProtectionAgreementCities”.
- For In the Geoprocessing pane, for ‘X Field’, ensure the Longitude field is selected.
- For ‘Y Field’, ensure the Latitude field is selected.
Notice in the ‘Spatial Reference’ drop-down menu, it defaults to GCS_WGS_1984, which is the most commonly used geographic coordinate system for mapping latitude and longitude and happens to be the correct one to select in this case.
- Ensure that your 'Copy FeaturesXY Table To Point' tool parameters match those shown below and click OK.

- Click Run.
The points should now appear on top of the United States and the map should automatically zoom to the extent of the points, since they were the first layer added.
Exporting XY Data
At this point, you are simply visualizing the data contained in the Excel spreadsheet, but you have not yet created a standalone point feature class. Since the points appear to be in reasonable locations (rather than in another country or the middle of the ocean), you will want to export them to a new feature class in your XY geodatabase. Exporting to a feature class will allow you to reuse this points layer in other future maps without having to go through the display XY data process each time.
- Right-click the Sheet1$_Layer and select Data > Export Features.
In the Geoprocessing pane, in the 'Copy Features' tool, notice that for 'Input Features' Sheet1$_Layer is already selected, since that was the table used to open the tool.
...
Since you now have a permanent feature class, you may remove your temporary Sheet1$ layer and the corresponding Excel table.
- Right-click the Sheet1$_Layer layer and select Remove.
- Right-click the Sheet1$ standalone table and select Remove.
If you’d like to get a better view of your points, use the navigate tools on the Map tab to zoom in to the continental United States. the map should automatically zoom to the extent of the points, since they were the first layer added. You have successfully mapped point locations using XY coordinates.
...
Converting Addresses to XY Coordinates
If all of your data already comes with a list of the latitudes and longitudes of the points you’d like to map, then you are ready to go straight into ArcGIS Pro, but what if you have a list of cities or addresses that you’d like to map, but you don’t know their corresponding coordinates? This section will show you one automated method of generating such coordinates based on address locations.
...
- Ensure that the break lines in the ‘Data preview’ box are placed like those shown below and click Next >.
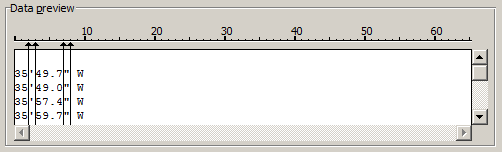
In order to import this information into GIS, the columns without the degrees and minutes information should be excluded, and you can do this by using the Do not import (skip) command. - In the ‘Data preview’ box, click the second column containing the apostrophes to select it.
- In the ‘Column data format’ box, select Do not import column (skip).

- Repeat steps 2 and 3 above with the fourth column containing the quotation marks and the fifth column containing the letter W.
- Click Finish.
...