...
- Click Intro.zip above to download the tutorial data.
- Open the Downloads folder.
- Right-click Intro.zip and select Extract All....
- In the 'Extract Compressed (Zipped) Folders' window, accept the default location into the Downloads folder.
- Uncheck Show extracted files when complete.
- Click Extract.
- Directly within the Downloads folder, drag the Intro folder onto your Desktop.
...
Getting Started with ArcGIS Pro
...
- Use the primary 'Symbology' drop-down menu to select Unique Values.Use the
- For 'Field 1' drop-down menu to select Name, select GEOID10, which contains a unique ID, called a FIPS code, for every census tract.
- When asked 'Do you you want to generate the full list of unique values?', click Yes.
- In the Contents pane, collapse the HGAC_tracts symbology.
Selecting Features Programatically
Selecting Features By Attributes
Sometimes you want to automatically select numerous features in a layer based on certain tabular criteria. In this case, you will select all the census tracts in Harris County out of the larger 13-county region. The COUNTYPF10 field in the attribute table contains the county FIPS code, which is '201' for Harris County.
Selecting Features By Attributes
- In the ribbon, click the In the ribbon, click the Map tab.
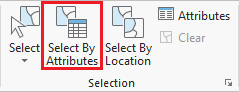
- In the Selection group, click the Select By Attributes button to open the Select Layer By Attribute tool in the Geoprocessing pane.
- In the Geoprocessing pane , click the Add Clause on the right, ensure 'Input Rows' says HarrisTracts. This layer was selected automatically, because it was selected in the Contents pane at the time you clicked the tool button.
- Click the New selection button.
- Use the drop-down menus to build the following expression: Name (COUNTYFP10 is Equal equal to 'UNIVERSITY PLACE' and click the Add button.201').
- At the bottom of the Geoprocessing pane, click RunClick Apply.
Exporting Selected Features
- In the Contents pane, right-click the HGAC_tracts layer name and select Data > Export Features.
- In the Geoprocessing pane, click the for 'Output Feature Class' field to edit the name. Replace HGAC_tracts with "MyTract". Ensure type "HarrisTracts". If the full file path is shown, ensure that you leave everything in the file path through Intro.gdb\.
Selecting Features By Location
Now we will create a map of the bus stops and bus routes within your neighborhood. We could continue to do our mapping within the existing map, but, since we are now focusing on different thematic layers in a different geographic extent, this could be a good time to create a second map within our project.
...
- At the bottom of the Geoprocessing pane, click Run.
- To see the results, in the Contents pane, right-click the newly exported HarrisTracts layer name and select Zoom To Layer.
- In the Contents pane, right-click the original HGAC_tracts layer and select Remove. Note that this process does not delete the layer from your project geodatabase, but only removes the layer from this particular Census Tracts map.
Now you will repeat the above process to select the census tract for Rice University.
- In the 'Selecting Features By Attributes' section above, repeat steps 2-5 for the HarrisTracts layer with the expression: (GEOID10 is equal to 48201412100). You can type in the FIPS code to have it highlighted in the drop-down list rather than scrolling through the entire list to locate it.
You should see the Rice University census tract selected on your map, as shown below. Next you will zoom in closer.
- In the Contents pane, right-click the HarrisTracts layer name and select Selection > Zoom To Selection.

- In the 'Exporting Selected Features' section above, repeat steps 1-3 with the HarrisTracts layer. for 'Output Feature Class' type "Rice".
Selecting Features By Location
Now we will create a map of the bus stops and bus routes that serve the Rice campus. We could continue to do our work within the existing map, but, since we are now focusing on different thematic layers in a different geographic extent, this could be a good time to create a second map within our project.
- On the ribbon, click the Insert tab.
- In the Project group, click the New Map button.
- At the bottom of the Geoprocessing pane, click the Catalog pane tab.
- Rename the new Map1 to "Rice Bus Routes".
- From the Catalog pane, within the Intro.gdb geodatabase, add the METRO_BusRoutes, METRO_BusStops, and Rice feature classes to the new Rice Bus Routes map.
- in the Contents pane, right-click the Rice layer name and selectZoom To Layer.
You will now select all the bus stops within the Rice census tract. To include bus stops across the street from Rice, you will add a search distance of 50 feet from Rice.
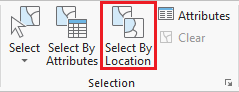
- On the ribbon, in the Selection group, click the Select By Location button to open the Select Layer By Location tool in the Geoprocessing pane.
- For 'Input Features', select METRO_BusStops.
- For 'Relationship', select Within a distance.
- For 'Selection Features', select Rice.
- For 'Search Distance', type '50' Feet.
- Ensure the 'Selection type' is New selection.
- Ensure your 'Select Layer By Location' tool settings appear as shown below and click Run.

Do not clear the selection, as we will use the selected bus stops to now select the bus routes within 100 ft of a bus stop in your neighborhood. - In the 'Select Layer by Location' tool, for the 'Input Feature Layer', select METRO_BusRoutes.
- For 'Relationship', select Within a distance.
- For 'Selecting Features', select METRO_BusStops.
- For 'Search Distance', type "100" Feet.
- Ensure the 'Selection type' is 'New selection'.
- Ensure your 'Select Layer By Location' tool settings appear as shown below and click Run.

All bus stops within 50 feet of Rice, as well as all bus routes that are 100 feet from those stops should now be selected on your map, as shown below.
- In the Contents pane, right-click METRO_BusRoutes and select Data > Export Features.
- In the Geoprocessing pane, for 'Output Feature Class' type "RiceBusRoutes". Ensure that you leave everything in the file path through Intro.gdb\.
- Click Run.
- In the Contents pane, right-click METRO_BusStops and select Remove.
- Right-click the original METRO_BusRoutes and select Remove.
You should now have two layers in your Contents pane: RiceBusRoutes and Rice. - In the Contents pane, right-click RiceBusRoutes and select Zoom To Layer.
The result is a map showing you everywhere you can get by bus from the Rice campus without transferring between routes.
...
Presenting and Sharing Maps
...
Once you are finished with your analysis, you may want to create a map that is suitable for adding to a report, presentation, or sharing with others who don't have access to ArcGIS software.
- On the ribbon, click the Insert tab.
- Click the New Layout button.
- If you wanted to create a custom image size for insertion into a report or presentation, you could select Custom page size at the bottom of the options, but for a full page layout, select Letter 8.5" x 11" at the top left of the options.
your analysis, you may want to create a map that is suitable for adding to a report, presentation, or sharing with others who don't have access to ArcGIS software.
- On the ribbon, click the Insert tab.
- Click the New Layout button.
- If you wanted to create a custom image size for insertion into a report or presentation, you could select Custom page size at the bottom of the options, but for a full page layout, select Letter 8.5" x 11" at the top left of the options.
- On the Insert tab, click the Map Frame button with the drop-down arrow.
- Under the 'Rice Bus Routes' map section, select the second frame that is labeled with a scale, such as 1:500:000.
- Click and hold near the top left corner of the layout page and drag the rectangle near the bottom right corner or the layout page.
On the Insert tab, the Map Surrounds group and Text group have buttons which allow you to insert a legend, scale bar, text box, and more. Detailed More tips for creating a layout are covered in the Map Layouts for Publication short course.
...
- On the ribbon, click the Share tab.
- Click the Export Layout button.Layout button.
- For 'File Type', select PDF.
- For 'NameOn the left, click the Browse button and navigate to the Desktop > Intro folder.
- Double-click the Intro folder.
- At the bottom of the 'Export' window, for File name:, type "Rice Bus Routes".
- Click SaveFor 'Resolution (DPI)', type "300".
- Click Export.
- Save and close the project.
- Open the saved PDF in your Intro folder to see the result.
To continue learning intermediate topics in ArcGIS, refer to the courses in the other ArcGIS Pro Series.