| Info |
|---|
This guide was created by the staff of the GIS/Data Center at Rice University and is to be used for individual educational purposes only. The steps outlined in this guide require access to ArcGIS Pro software and data that is available both online and at Fondren Library. |
| Table of Contents |
|---|
| Info |
|---|
The following text styles are used throughout the guide: Explanatory text appears in a regular font.
Folder and file names are in italics. Names of Programs, Windows, Panes, Views, or Buttons are Capitalized. 'Names of windows or entry fields are in single quotation marks.' "Text to be typed appears in double quotation marks." |
| Info |
|---|
The following step-by-step instructions and screenshots are based on the Windows 7 operating system with the Windows Classic desktop theme and ArcGIS Pro 2.1.3 software. If your personal system configuration varies, you may experience minor differences from the instructions and screenshots. |
Obtaining the Tutorial Data
Before beginning the tutorial, you will copy all of the required tutorial data onto your Desktop. Option 1 is best if you are completing this tutorial in one of our short courses or from the GIS/Data Center and Option 2 is best if you are completing the tutorial from your own computer.
OPTION 1: Accessing tutorial data from Fondren Library using the gistrain profile
If you are completing this tutorial from a public computer in Fondren Library and are logged on using the gistrain profile, follow the instructions below:
- On the Desktop, double-click the Computer icon > This PC > GISData (\\smb.rdf.rice.edu\research\FondrenGDC) (O:) > GDCTraining > 1_Short_Courses > Mapping_Tabular_Data.
- To create a personal copy of the tutorial data, drag the Tabular folder onto the Desktop.
- Close all windows.
OPTION 2: Accessing tutorial data online using a personal computer
If you are completing this tutorial from a personal computer, you will need to download the tutorial data online by following the instructions below:
| Info | ||
|---|---|---|
| ||
- Click Tabular.zip above to download the tutorial data.
- Open the Downloads folder.
- Right-click Tabular.zip and select Extract All....
- In the 'Extract Compressed (Zipped) Folders' window, accept the default location into the Downloads folder and click Extract.
- Drag the unzipped Tabular folder onto your Desktop.
- Close all windows.
Joining Tabular Data in ArcGIS Pro
Opening an Existing Project
- On the Desktop, double-click the Tabular folder.
- Double-click the Tabular.aprx project file to open the project in ArcGIS Pro.
Adding Tabular Data
You will now add a feature class to a new map that depicts all of the land parcels in downtown Houston. This feature class was obtained from the Harris County Appraisal District (HCAD) Public Data GIS website at http://pdata.hcad.org/GIS/index.html. The original parcels shapefile contained all of the parcels in Harris County, but working with such a large file can be time consuming, so, for the purposes of this tutorial, the layer was clipped to contain only those parcels in downtown Houston.
- In the Catalog pane on the right, expand the Databases folder.
- Expand the Tabular.gdb geodatabase.
- Right-click the DowntownParcels feature class and select Add To New Map.
You will now examine the DowntownParcels layer’s attribute table.
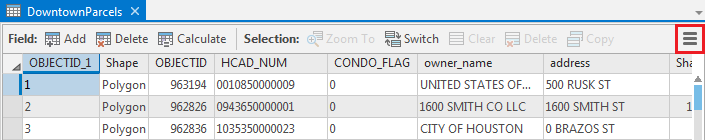
- In the Contents pane on the left, right-click the DowntownParcels layer name and select Attribute Table.
The HCAD_NUM field contains the unique 13-digit HCAD account number for each parcel. You are also provided with the owner name and address for each parcel, but no other information. Fortunately, a tremendous amount of information about the parcels can be obtained from HCAD in standalone tabular format. In this case, you would like to know the particular land use for each parcel, such as residential, commercial, or industrial. This information is contained in a separate Land table, which was obtained from the HCAD Public Data Download website at the http://pdata.hcad.org/download/index.html.
- Close the DowntownParcels table view.
- In the Catalog pane, within the Tabular geodatabase, right-click the Land table and select Add To Current Map.
Notice that the Land table has been added to the bottom of the Contents pane under a new 'Standalone Tables' section. This is because the table does not currently have spatial information associated with it, so it cannot yet be displayed on the map and, therefore, cannot be listed by drawing order.
- In the Contents pane, right-click the Land table and select Open.
Notice that you are again provided with the unique 13-digit HCAD account number, but, this time, the field name is ACCOUNT, rather than HCAD_NUM, as it was in the DowntownParcels layer attribute table. When you perform a join, you are able to specify the field names of the two common join fields, so it is okay for them to have different field names, so long as the actual data contained within the two fields is identical.
You are also provided with the land use code and the land use description for each parcel. In order to symbolize the parcels by land use, you will first need to join the land use table to the parcels feature class. You will now explore the various land use codes.
- Right-click the LAND_USE_C field and select Sort Ascending.
- Using the scroll bar to the right of the table, click and hold the scroll down arrow button to scan the data slowly or click and hold on the gray scroll bar region directly above the scroll down arrow to scan the data more quickly. Browse through all of the land use codes and descriptions.
Notice how many different land use categories there are. For example, commercial land use is divided into very specific categories, such as Restaurant, Ice House, Bar/Lounge, Day Care Center, Medical Office, and Bank. While it is great to have this information available, symbolizing so many different categories on a single map can make the map difficult to interpret. Instead, it might be preferable to symbolize the parcels using more generalized land use categories. Fortunately, the City of Houston has created a lookup table that assigns each appraisal district land use code to one of ten generalized land use categories. You will now explore this lookup table.
- In the Catalog pane, within the Tabular geodatabase, right-click the LandUseCode_LookupTable table and select Add To Current Map.
- In the Contents pane, right-click the LandUseCode_LookupTable table and select Open.
- Scroll down and browse through the land use descriptions and the associated group descriptions.
Notice that the COUNTY field tells you which county uses the particular land use code listed. “HCAD” stands for Harris County. If you scroll down to the bottom of the table, you will notice “FBCAD” and “MCAD” for Fort Bend County and Montgomery County, respectively. The LANDUSE_CODE and LANDUSE_DESCRIPTION fields should look familiar, since they contain the same information as the Land table you looked at previously. The GROUP_CODE and GROUP_DSCR fields store one of ten general land use categories that correspond to each specific land use code. In order to symbolize the parcels using these generalized land use categories, you will also need to join the lookup table to the land use table and the parcels feature class. You will perform the join using the land use code field that is common to both your land use table and your lookup table.
- Close all table views.
- Above the ribbon, on the Quick Access toolbar, click the Save button.
Joining Tabular Data
Now that you have examined all of the data tables, you are ready to join them all together. It is possible to join tables together in any order, but you will want to join both land use tables to the back of your DowntownParcels attribute table, so that you can later symbolize the parcels based on their land use. You will first join the Land table to the DowntownParcels feature class using the unique HCAD account number as the common join field.
- In the Contents pane, right-click the DowntownParcels layer name and select Joins and Relates > Add Join.
The Geoprocessing pane should open on the right in a new tab overlaying the Catalog pane. In the Add Join tool, notice that 'Layer Name or Table View' is already set to the DowntownParcels layer, since that was the layer used to open the tool.
- For ‘Input Join Field’, use the drop-down menu to select the HCAD_NUM field.
- For ‘Join Table’, use the drop-down menu to select the Land table.
- For ‘Output Join Field’, use the drop-down menu to select the ACCOUNT field.
- Ensure that the ‘Add Join' tool settings match those shown below and click Run at the bottom of the Geoprocessing pane.

- In the Contents pane, right-click the DowntownParcels layer and select Attribute Table.
- Scroll to the right and browse through all fields.
Notice the four new fields added to the end of the DowntownParcels attribute table showing the land use for every parcel. This is an example of a successful tabular join.
Because you want to symbolize the parcels using the more generalized land use categories, you will now also join the LandUseCode_LookupTable table using the land use code as the common field.
- In the Contents pane, right-click the DowntownParcels layer and select Joins and Relates > Add Join.
- For ‘Input Join Field’, use the drop-down menu to select the Land.LAND_USE_C field. If that field does not appear in the list, you may have skipped the step above and are still viewing the previous run of the Add Join tool, which has not been refreshed to load the newly joined field names.
Notice that when a previous join is still active, the field names are automatically appended with the name of the layer or table from which they are derived.
- For ‘Join Table’, use the drop-down menu to select the LandUseCode_LookupTable table.
- For ‘Output Join Field’, use the drop-down menu to select the LANDUSE_CODE field.
- Click Run.
- Once the join is complete, scroll to the far right in the DowntownParcels attribute table.
Notice that all of the values in the six newly joined fields are null. This is an indication that something is wrong with the join. The two most common reasons for a join not to work are either the data values in the two common join fields are not identical between tables or the standalone join table itself is not formatted correctly for import into ArcGIS, which would only occur if it is imported from another file format, such as Excel or CSV. In this case, the standalone join table was already in a native ArcGIS file geodatabase, so there should not be a problem with the overall table formatting. Instead, you will look into the actual values stored within the land use code field in both tables for any discrepancies.
Troubleshooting Joins
You will now examine the two tables more closely to determine why the join resulted in null values.
- At the top right of the DowntownParcels table view, click the collapsed menu icon (or hamburger button) and select Fields View.
This fields view displays a list of all the fields in the corresponding attribute table, along with their field properties. In the 'Field Name' column, locate the Land.LAND_USE_C field. In the 'Data Type' column to the right, notice that the data type is Long, which stands for long integer. In other words, the data is stored in a numeric field. Further down the table, locate the LandUseCode_LookupTable.LANDUSE_CODE field. To the right, notice that the data type is Text. Even if the 4-digit codes stored in both fields are identical, the join will not work if one table stores the values as numbers and one stores the values as text. If the data types in both fields had matched, then the join error would likely have been due to the actual data (or 4-digit codes) being different or selecting the incorrect column name on which to perform the join.
In order to successfully perform a join, the corresponding join fields in both tables must be of the same field type. Unlike in Excel, you cannot simply convert an existing field from one type to another. Instead, you must create a new field of the correct field type and copy the data over into the new field. In this case, you will convert the LAND_USE_C field in the Land table to a text field type to match the text field type used in the LandUseCode_LookupTable table.
- In the Catalog pane, right-click the Land table and select Design > Fields.
- At the bottom of the attribute table, click ‘Click here to add a new field.’
- For the new ‘Field Name’, type “LAND_USE_C_Text” and press Enter.
- For ‘Data Type’, click once to highlight Long and activate the field and then click Long a second time and use the drop-down menu to select Text instead.
- On the ribbon, the Fields tab should now be active. In the Changes group on the far right, click the Save button to save the changes to the design of the Land table fields.
The new LAND_USE_C_Text field has now been added to the end of the Land table.
- Close both table Fields: views.
- In the Contents pane, right-click the Land table and select Open.
- Right-click the LAND_USE_C_Text field name and select Calculate Field.
On the right, in the Geoprocessing pane, the Calculate Field tool will open.
- In the 'Fields' list, double-click the LAND_USE_C field.
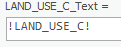
Notice that the box below now reads LAND_USE_C_Text = !LAND_USE_C!, as shown below. This statement will copy all of the content from the original LAND_USE_C integer field into the new LAND_USE_C_Text text field.
- Click Run.
In the Land table view, ensure that the land use codes have, indeed, been copied over into the new LAND_USE_C_Text field and that they are left-aligned as text, rather than right-aligned as numbers.
- Close the Land table view. Only the DowntownParcels table view should still be open.
You will now attempt to join the lookup table again using the newly edited text field, but you will first need to remove the original join.
- In the Contents pane, right-click the DowntownParcels layer name and select Joins and Relates > Remove Join.
In the Geoprocessing pane, the Remove Join tool will open.
- For 'Layer Name or Table View', leave the default DowntownParcels layer selected.
- For 'Join', use the drop-down menu to select the LandUseCode_LookupTable table.
- Click Run.
You will now repeat the process of joining the lookup table.
- In the Contents pane, right-click the DowntownParcels layer and select Joins and Relates > Add Join.
- For ‘Input Join Field’, select the new Land.LAND_USE_C_Text field.
- For ‘Join Table’, select the LandUseCode_LookupTable table.
- For ‘Output Join Field’, select the LANDUSE_CODE field.
Ensure that the ‘Add Join’ pane matches that shown below and click Run.
- If your DowntownParcels table view is not already open, right-click the DowntownParcels layer name and select Attribute Table.
- In the DowntownParcels table view, scroll to the right and browse through all of the attributes.
Notice that the generalized group code and description fields have been added to the end of the attribute table.
- Close the DowntownParcels attribute table.
- Above the ribbon, on the Quick Access toolbar, click the Save button.
Exporting Tabular Data
The joins that you have created are only stored in this particular map view. In other words, none of the original tables have been modified. If you were to add the DowntownParcels layer to another new map, you would no longer see the joined tables at the back of the layer’s attribute table. In addition, if your joined data tables were ever moved or deleted, the joined data would no longer be visible in this map view. For this reason, it is often a good idea to export data containing successful tabular joins, so that you do not have to worry about losing the joined data in the future.
- Right-click the DowntownParcels layer and select Data > Export Features.
- For ‘Output Feature Class’, click the Browse button.
- Double-click the Tabular.gdb geodatabase.
- For 'Name', type “DowntownParcels_WithLandUse” and click Save.
- Click Run.
- Right-click the DowntownParcels_WithLandUse layer name and select Attribute Table.
Notice that all of the joined attributes are now a permanent part of this new feature class attribute table. Since this permanent feature class contains everything you need in one layer, you may now remove your original parcels layer and both joined tables.
- Close the DowntownParcels_WithLandUse table view.
- In the Contents pane, right-click the DowntownParcels layer name and select Remove.
- Right-click the Land table and select Remove.
- Right-click the LandUseCode_LookupTable table and select Remove.
- Above the ribbon, on the Quick Access toolbar, click the Save button.
You have successfully joined tabular data in ArcGIS Pro!
Symbolizing Tabular Data
You will now symbolize the parcels according to their generalized land use categories.
- In the Contents pane, right-click the DowntownParcels_WithLandUse layer name and select Symbology.
- In the Symbology pane that opens over the Catalog pane, use the 'Symbology' drop-down menu to select Unique Values.
- For ‘Value field’, use the drop-down menu to select the GROUP_DSCR field.
- To the top right of the tabular list of symbols, values, and labels, click the More drop-down menu and uncheck Show all other values, since you will be symbolizing all values.
You will want to group “Commercial” and “Office” into one land use category.
- In the table, click the Commercial value to select it.
- Hold down Ctrl and click the Office value to select it too.
- Right-click the Commercial value and select Group values to combine the two categories into one.
- In the Contents pane, right-click each symbol patch individually from the row indicated below.

- Select the colors commonly used by planners to represent each land use, as displayed below.

- Above the ribbon, on the Quick Access toolbar, click the Save button.
- Minimize ArcGIS Pro.
Formatting Tabular Data in Excel for Joining
In the first exercise using HCAD data, both the layer attribute table and the join table were already formatted properly, so that you could bring them directly into ArcGIS. Unfortunately, such a situation rarely occurs and most data tables require some formatting to prepare them for import into ArcGIS.
In this exercise, you will be mapping land cover by state. The original data table was obtained from the 2011 Statistical Abstract published by the U.S. Census Bureau at http://www.census.gov/compendia/statab/. The particular table was accessed from the “Geography & Environment” section under the “Land, Land Use, and Earthquakes” category and was called table “265, Land Cover/Use by State: 2003”. You will now format this table for import into ArcGIS.
- Double-click the Tabular folder on the Desktop.
- Double-click LandCoverByState to open the file with Excel.
Along the left side of the spreadsheet are the row numbers. Along the top of the spreadsheet are the column letters. When you are asked to click on a row or column, you will be clicking directly on these numbers and letters.
Removing Extraneous Data from Excel Worksheets
Notice that the first three rows contain title information for the table, but do not contain any data, so you will delete these rows. Notice also that row 1 is barely visible, because its height has been greatly reduced.
- Click and hold row 3 and drag the mouse up past the top of the spreadsheet to select rows 1 through 3.
- Right-click row 3 and select Delete.
Sometimes data tables contain a lot more information than you actually need. While it is okay to import large tables into ArcGIS Pro, it can make future tasks more difficult for you. Every time you have to select a particular field for symbology, labels, or queries, you will have to scroll through a long list of fields, rather than a targeted list containing only your selected variables of interest. For this reason, it is ideal to remove all unnecessary data columns in Excel before importing into ArcGIS.
For this particular exercise, you will map the percent of all land that is developed land and the percent of all nonfederal land that is forest land. Such a task will require keeping the columns titled “State,” “Total surface area,” “Forest land,” “Developed Land,” and “Water Areas.” You will remove all of the rest of the columns.
- Click column C to highlight the entire column.
- Hold down Ctrl and click columns D, E, F, H, I, L, M, N, O, P.
Ensure that you are left with the five necessary columns previously mentioned unselected.
- Right-click column P and select Delete.
The selected columns should disappear and you should be left with the columns labeled “State,” “Total surface area,” “Forest land,” “Developed Land,” and “Water Areas.”
When you bring an Excel table into ArcGIS, it assumes that the first row contains the field name and then it assumes the data begins in the second row. Whatever data type it sees in that second row, it assumes is the data type for the entire column. If there is ever more than one row containing title information, ArcGIS will see that title text in the entire second row and assume that all the data contained in the entire table is text, when, in fact, the majority of the data is numerical. In short, all but one field name row must be removed, but, first, you must create an appropriate field name row.
- Right-click row 4 and select Insert.
This newly inserted row will contain your field names. For field names, you should not use any spaces or special characters and should not start with a numeral or use more than 13 characters. You may use underscores, mixed case letters, and numerals (in the middle or end of the field name only).
- In row 4, type the following field names: “State” “Total” “Forest” “Developed” “Water”. After typing each word, press Delete (rather than Enter or the right arrow), so that the unwanted remainder of each phrase is not copied from the row above. Ensure that there is not an extra space after the word “State”.
Since you have created a row with appropriate field names, you may now delete all rows above it.
- Click row 1.
- Hold down Shift and click row 3.
- Right-click row 3 and select Delete.
Because you are mapping data for each state, you do not need the total data for the entire United States contained in row 2 or the accidental repeat of the Alabama data in row 3.
- Click row 2.
- Hold down Shift and click row 3.
- Right-click row 3 and select Delete.
Scroll to the bottom of the table and notice there are extra rows that do not contain data here, as well.
- Click row 50 (FOOTNOTE:).
- Hold down Shift and click row 56 (Internet release date:).
- Right-click row 56 and select Delete.
Using Formulas in Excel
At this point, the table is mostly cleaned up, so you will add two new columns to calculate the percent of the total land area that is developed and forest.
- In cell F1, type “Per_Forest”.
- In cell G1, type “Per_Developed”.
Now you will calculate the formula where Per_Forest = Forest/(Total-Water).
- In cell F2, type “=” to indicate the start of a formula.
- Click cell C2 (Alabama Forest).
- Type “/(” (divided by, open parenthesis).
- Click cell B2 (Alabama Total).
- Type “-” (minus sign).
- Click cell E2 (Alabama Water).
- Type “)*100” (close parenthesis, times 100).
- Ensure your cell says “=C2/(B2-E2)*100” and press Enter to finish the formula.
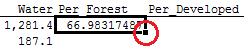
- Click cell F2 containing the formula you just entered.
Hover your cursor over the small black box in the bottom right corner of the highlighted cell as shown below. Notice that your cursor changes from a thick white cross to a thin black cross.
- Double-click the black box in the bottom right of cell F2 to copy the formula down the table.
- In cell G2, use the same formula building techniques to enter “=D2/(B2-E2)*100” and copy the formula down the table.
One last problem with this worksheet, which is difficult to detect, is that there is actually a space stored after every state name. This space will prevent the table from joining properly to another table whose state names do not have a trailing space. You will now use the TRIM function to remove this extra space. The trim function removes all extra spaces from text, leaving only a single space between words and no spaces at the start or end of the text.
- Right-click column B and select Insert to add a new column in which to work.
- In cell B2, type “=” to indicate the start of a formula.
- Type “trim(”.
- Click cell A2 (Alabama).
- Type “)” (close parenthesis).
- Ensure your cell says “=trim(A2)” and press Enter to finish the formula.
- Copy the formula down the table.
Removing all formatting in Excel
At this point your table has everything you need and nothing extra (except for a duplicate state name field, which will be deleted shortly), but it is always recommended to clear all formatting and programming before bringing the Excel file into ArcGIS. In addition, columns B, G, and H currently have formulas, which need to be converted to text before ArcGIS can read them properly. To get rid of all formatting and formulas, you will copy all of the data into a new blank worksheet as text.
- Click the Select All button in the top left corner of the spreadsheet.

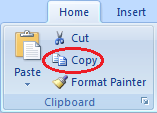
- In the Home tab, click Copy.
- Click the File tab and select New.
- Click Blank Workbook.
- In the new workbook, right-click cell A1 and select Paste Special….
- Select to paste Values and click OK.
You should now have a clean version of your data with no special formatting. Next you will expand the cells to ensure that all of their content is displayed. Ensure that all data is still selected from being pasted. Hover your cursor over one of the lines between any two of the column letters. Notice that your cursor changes from a single arrow pointing down to a double arrow pointing left and right.
- Double-click the dividing line between column A and B.
The width of all your columns should now be expanded to show all of the content of the cells.
Finally, you will delete the original State column, which still contains trailing spaces.
- Right-click column 1 and select Delete.
- In the new cell A1, type "State" to fill out the missing field name.
You are finished formatting your table.
- Click the File tab and select Save As.
- Click the Browse button.
- In the 'Save As' window, on the left, click Desktop.
- On the right, double-click the Tabular folder on the Desktop.
- For ‘File name:’, type “US_LandCover”.
- Click Save.
- Close Excel.
Setting Up a New Map in an Existing Project
Now you will return to ArcGIS to map the land cover data by state.
- Maximize ArcGIS Pro.
- At the bottom of the right pane, click the Catalog tab.
- In the Catalog pane, within the Tabular geodatabase, right-click the US_States feature class and select Add To New Map.
This creates a new map in the project in which you will map your state land cover data. You will now save this map with a different name, so as to distinguish this exercise from the last one.
- In the Catalog pane, expand the Maps folder.
- Right-click Map1 and select Rename.
- Type “US Land Cover” and press Enter.
You will now explore the state data.
- In the Contents pane, right-click the US_States layer and select Attribute Table.
Examine the attribute table for the US_States layer and notice that the field containing the state names is “NAME10”.
- Close the US_States table view.
- At the bottom of the right pane, click the Geoprocessing tab.
- At the top left of the Geoprocessing pane, click the Back button.
- In the 'Find Tools' search bar type "excel".
- Click Excel to Table (Conversion Tools).
- For the Input Excel file, click the Browse button to the right and navigate to your Tabular folder on the Desktop. Select USLandCover.xlsx and click Open.
It will take a moment for the table to load. Note that the 'Sheet' drop-down menu is now populated and Sheet1 is selected by default. Because a single Excel file can have multiple worksheets and each worksheet is treated in ArcGIS as a separate table, you must always specify which specific worksheet you want to use.
- Rename the Output Table "US_LandCover".
- Ensure the Geoprocessing pane appears as shown below and click Run.

- At the bottom of the right pane, click the Catalog tab.
- Within the Tabular geodatabase, right-click the newly created US_LandCover table and select Add to Current Map.
Examine the US_LandCover table and notice that the field containing the state names is “State”. Using your knowledge from the first exercise, try to join the US_LandCover worksheet to the US_States feature class and symbolize the states by both the percent developed land and the percent forest land. If you get stuck, ask for help.