...
- In the Contents pane, right-click the HPDBeats_North layer layer name and select Attribute Table.
...
- In the Contents pane, right-click the HPDBeats_South layer name and select Attribute Table.
...
- In the Contents pane, right-click the HPDBeats layer layer name and select Attribute Table.
...
- In the Contents pane, right-click the HPDBeats_North layer name and select Remove.
- In the Contents pane, right-click the HPDBeats_South layer name and select Remove.
- Above the ribbon, on the Quick Access toolbar, click the Save button.
...
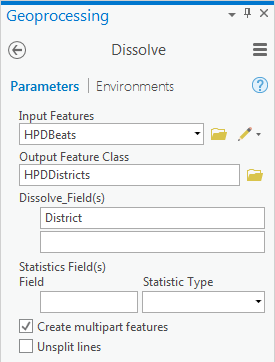
- For ‘Input Features’, use the drop-down menu to select the HPDBeats layer.
- For ‘Output Feature Class’, rename the feature class from HPDBeats_Dissolve to “HPDDistricts”.
- For ‘Dissolve_Field(s)’, use the drop-down menu to select the District field, since this is the field containing the common district values you wish to dissolve on.
- Ensure that your Dissolve tool Parameters tab appears as shown below, and click Run.
- In the Contents pane, uncheck and recheck the new HPDDistricts layer to toggle it on and off the map and understand the result of the Dissolve tool.
- In the Contents pane, right-click the HPDDistricts layer layer name and select Attribute Table.
...
- In the Contents pane, right-click the HPDBeats layer layer name and select Remove.
- Above the ribbon, on the Quick Access toolbar, click the Save button.
...
- In the Contents pane, right-click the HPDDistricts layer layer name and select Remove.
You will now work with a dataset containing the locations of all violent crimes (including murder, rape, aggravated assault, and robbery) occurring in 2010, as reported by HPD. Though the data has been pre-processed for this tutorial, the original data tables can be obtained online from the Houston Police Department Crime Statistics webpage at https://www.houstontx.gov/police/cs/crime-stats-archives.htm.
...
- In the Contents pane, right-click the HISDCrime2010_HISD layer layer name and select Attribute Table.
...
- Close the HISDCrime2010_HISD table view.
- In the Contents pane, right-click the original HPDCrime2010 layer layer name and select Remove.
- In the Contents pane, right-click the HISD layer name and select Zoom To Layer.
- In the Contents pane, uncheck the HPDCrime2010_HISD and HISD layers, so that only the HPDDistricts_HISD layer is visible.
- Above the ribbon, on the Quick Access toolbar, click the Save button.
...
- At the bottom of the Geoprocessing pane, click the Catalog tab.
- In the Catalog pane, within the Geoprocessing geodatabase, right-click the HISDElemSchools feature class and select Add To Current Map.
- In the Contents pane, right-click the HISDElemSchools layer layer name and select Attribute Table.
...
- At the bottom of the Catalog pane, click the Geoprocessing tab.
- At the top of the Geoprocessing pane, click the Back arrow button.
- Within the already expanded Analysis Tools toolbox, click the Proximity toolset > Buffer tool.
- For ‘Input Features’, use the drop-down menu to select the HISDElemSchools layer.
- For ‘Output Feature Class’, rename the feature class from HISDElemSchols_Buffer to “HISDElemSchools_HalfMileBuffer”.
- For ‘Distance [value or field]’, type “0.5” and use the unit drop-down menu to select Miles.
- Click Run.
- In the Contents pane, right-click the HISDElemSchools_HalfMileBuffer layer layer name and select Attribute Table.
...
- Close the HISDElemSchools_HalfMileBuffer table view.
- In the Contents pane, uncheck the HISDElemSchools layer and layer and check the HPDCrime2010_HISD layer.
- Above the ribbon, on the Quick Access toolbar, click the Save button.
...
The goal of performing this spatial join is to add a numeric field to the end of the school buffer attribute table that tells you how many crime points are contained within each school buffer.
...
The 'Field Map of Join Features' describes how the features will be summarized as they are joined. The first half of the list of fields displays the attributes of the school buffer layer, ending with the Shape_Area field. The second half of the list of fields, beginning with the Date field, displays the attributes of the crime layer. A count field showing indicating how many crime points intersect with each half-mile buffer will automatically be provided, but, s. Since many crimes will be appended to each school buffer, it does not make sense to generate summary statistics about the crime fields, since things because variables like offense type, premise code, and address cannot be averaged. By default, the table would actually output only the attributes of the first crime encountered within each buffer, which could be very misleading. Therefore, you will remove all the crime attributes from the output fields.
- Within 'Output Fields', click the Date field.
- Hold down Shift and click the last Address field, so that all of the crime fields are selected, as shown below.

- Right-click on the the selected Address field and select Remove.
- Ensure that your Spatial Join tool Parameters tab appears as shown below and click Run.

- In the Contents pane, right-click the new HISDElemSchools_HalfMileBuffer_WithCrimeStats layer layer name and select Attribute Table.
Notice the newly added Join_Count field. This field tells you how many crime points are contained within each school buffer.
- Close the HISDElemSchools_HalfMileBuffer_WithCrimeStats table view.
Notice also that only the fields from the schools attribute table have been included in the result, because we removed all the crime fields from the output.
- Close the HISDElemSchools_HalfMileBuffer_WithCrimeStats table view.
Since the newly joined schools Since the newly joined buffer layer contains all of the same information as the original schools buffer layer, plus the new Join_Count and Sum fields field, you no longer need the original buffer layer. Since your crime data has now been summarized, you no longer need the original crime points either.
- In the Contents pane, right-click the HISDElemSchools_HalfMileBuffer layer layer name and select Remove.
- In the Contents pane, right-click the HPDCrime2010_HISD layer name and select Remove.
- Right-click the HISDElemSchools_HalfMileBuffer_WithCrimeStats layer name and select select Symbology.
The Symbology pane..pane has opened on the right as a new tab on top of the Geoprocessing pane.
- For ‘Primary symbology‘Symbology', use the drop-down menu to select Graduated Colors.
- For ‘Field:’‘Field’, use the drop-down menu to select the Join_Count field.In the ‘Color Scheme:’ box, leave the default selection of Graduated colors.
- Under the 'Upper Value value' column, click the first upper value box 23.000000 and type “25” and press Enter to move to the next range.
- Type “50” and press Enter.
- Type 100” and press Enter.
- Type 150” and press Enter.
- Leave upper bound.
- Enter.
- Click the second upper value and type “50” and press Enter.
- Click the third upper value and type “100” and press Enter.
- Click the fourth upper value and type “150” and press Enter.
Leave the fifth upper value as is, since this is the true upper value for the dataset. You can now easily tell which schools have the largest number of violent crimes occurring within a half mile radius.
...
- In the Contents pane, right-click the HISDElemSchools layer name and select Attribute Table.
- Scroll to the right and browse through all of the attributes.
Remember that, at this point, the attribute table only contains the school name, address, and grade range.
- Close the HISDElemSchools table view.
- In the Contents pane, right-click the HISDElemSchools layer name and select Joins and Relates > Spatial Join.
- For ‘Join Features’, use the drop-down box to select the HPDDistricts_HISD layer.
- For ‘Output Feature Class,’ rename the feature class from HISDElemSchools_SpatialJoin to “HISDElemSchools_WithHPDDistricts".
- Click Run.
...
- Right-click the HISDElemSchools_WithHPDDistricts layer layer name and select Attribute Table.
- Scroll to the right and notice the newly added District field. The District field tells you which police district each school falls within.
...