...
Notice in the ‘Spatial Reference’ drop-down menu, it defaults to the particular projection being displayed in our active data frame, which is currently WGS 84 Web Mercator Auxiliary Sphere. This is the particular projection of the basemap, automatically generated by ArcGIS, is the same projection used by most web mapping sites, including Google and Bing.
Look in the bottom center of the Map Display. You will see coordinates, such as “130.2718150°W 51.8563516°N”. In order to use this default projection, the XY coordinates in your spreadsheet would have to be similar large numbers in meters, but since they are provided in geographic coordinates of latitudes between -90 and 90 and longitudes between -180 and 180, you will need to specify a geographic coordinate system, rather than a projected coordinate system.
- Next to the ‘Spatial Reference’ drop-down menu, click the Atlas button.
- In the ‘Coordinate System’ window, scroll to the top of the list of projections.
Because the coordinates are in the form of latitude and longitude in decimal degrees, you know you will need to select a geographic coordinate system, rather than a projected coordinate system. While the data could theoretically be in any geographic coordinate system, you will select the World Geodetic System of 1984, commonly abbreviated WGS 84, because this is the reference coordinate system used by the Global Positioning System (GPS). Under most circumstances, this will be the best coordinate system to select when mapping latitude and longitude coordinates.
...
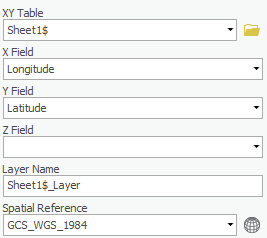
GCS_WGS_1984, which is the most commonly used geographic coordinate system for mapping latitude and longitude and happens to be the correct one to select in this case.
- Ensure that your window matches that below and click OK.
...
- Click Run.
The points should now appear on top of the United States and the map should automatically zoom to the extent of the points, since they were the first layer added.
- In the Contents pane, right-click the Sheet1$_Layer layer and select Zoom to Layer.
Exporting XY Data
Exporting XY Data
At this point, you are simply visualizing the data contained in the Excel spreadsheet, but you have not yet created a standalone point feature class. Since the points appear to be in reasonable locations (rather than in another country or the middle of the ocean), you will want to export them to a new feature class in your XYData geodatabase XY geodatabase. Exporting to a feature class will allow you to reuse this points layer in other future map documents maps without having to go through the display XY data process each time.
- Right-click the Sheet1$_Layer and select Data > Export Features.
Notice that the output feature class defaults to your default geodatabase (C:\Users\gistrain\Desktop\XYTutorialData\XYData.gdb)In the Geoprocessing pane, in the Copy Features tool, notice that for 'Input Features' Sheet1$_Layer is already selected, since that was the table used to open the tool.
- For ‘Output Feature Class’, click the Browse button, make sure the layer is within XYData.gdb, and rename the feature class “ClimateProtectionAgreementCities”. Click Save.from Sheet1_Features_CopyFeatures to “ClimateProtectionAgreementCities”.
- Ensure your Geoprocessing pane appears as shown Make sure your Geoprocessing pane looks like this below and click Run.
Since you are now using a permanent feature class, you may remove your temporary Sheet1$ layer and the corresponding Excel table.
...