TABLE OF CONTENTS
| Table of Contents |
|---|
| Info |
|---|
This guide was created by the staff of the GIS/Data Center at Rice University and is to be used for individual educational purposes only. The steps outlined in this guide require access to ArcGIS Pro software and data that is available both online and at Fondren Library. The following text styles are used throughout the guide: Explanatory text appears in a regular font.
Folder and file names are in italics. Names of Programs, Windows, Panes, Views, or Buttons are Capitalized. 'Names of windows or entry fields are in single quotation marks.' "Text to be typed appears in double quotation marks."
The following step-by-step instructions and screenshots are based on the Windows 10 operating system with the Windows Classic desktop theme and ArcGIS Pro 2.1.3 software. If your personal system configuration varies, you may experience minor differences from the instructions and screenshots. |
This tutorial uses data from Utah's Zion National Park, which contains such geologic wonders as red and tan sandstone rocks, steep cliffs, and multitudes of canyons. You will use the editing environment in ArcMap to create and modify spatial features to represent various natural and human-made phenomena in the park. After completing these exercises, you are able to create different types of new features, including points, lines, and polygons; assign attribute values; edit shapes; and build and use feature templates. You will also become familiar with many of the tools and parts of the user interface available to you when editing.
Obtaining the Tutorial Data
Before beginning the tutorial, you will copy all of the required tutorial data onto your Desktop.
- On the Desktop, double-click the Computer icon → gisdata (\\file-rnas.rice.edu) (Z:) > Short_Courses > Creating_Vector_Data.
- To create a personal copy of the tutorial data, drag the Editing folder onto the Desktop.
- Close all windows.
Exercise 1
Exercise 1a: Creating new points
Opening an existing project
In this exercise, you will use an aerial photograph to create a new point feature representing a park ranger station in Zion National Park. Once the feature is created, you will then add attribute values to the point. You are introduced to the Editor toolbar, the Create Features pane, and the Attributes pane, which are the main elements of the ArcGIS Pro user interface when editing.
- On the Desktop, double-click the ArcGIS Pro icon.
- Click Open an existing project….
- In the ‘Open’ dialog box, click the Browse button.
- Navigate to the Editing folder on the Desktop.
- Select Vector_data.aprx and click OK to open the project file.
Creating new points
To start this exercise, you first need to zoom the map to your area of interest. A spatial bookmark, which is similar to a bookmark in a Web browser, is a way to save frequently used locations on your map so you can easily access them. A bookmark has been created for you containing the map extent in which you will be working.
- Click the Bookmarks menu and select the Visitor center bookmark to zoom you to the area around a visitor center ranger station at the south entrance of Zion National Park.
- On the top ribbon menu, click the Edit tab.
- On the Edit toolbar, in the Features group, click the Create button.
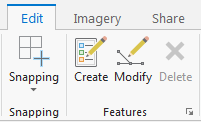
The ‘Create Features’ pane will open to the right of the Map Display.
4. In the ‘Create Features’ pane, click the Ranger stations point feature template
This sets up the editing environment so that you will be creating new point features in the Ranger stations layer.
These feature templates were created for you and saved in the tutorial map document. In a later tutorial exercise, you will create feature templates yourself and modify their properties.
5. Underneath the Ranger_Stations features template, make sure that the Point tool is selected. 
6. Using the aerial imagery as your guide, click once on the visitor center building in the center of the display to place a point directly over the visitor center, as shown below.

Since you are creating points, clicking the map once adds the feature. If you were drawing lines or polygons, however, you would need to use more than one click so you could create segments in between vertices. Notice that the center of the symbol is highlighted with a solid, cyan color (light, bright blue). By default, as soon as you create new features when editing, they are selected. This allows you to easily identify the new feature and add attribute values to it.
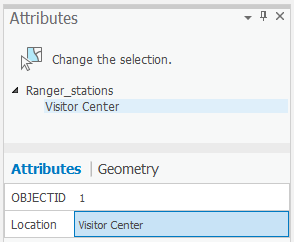
7. On the Edit toolbar, in the Selection Group, click the Attributes button. 
Using the ‘Attributes’ pane is a quick way of updating the attribute values of one or more selected features when you are editing. The top of the pane shows a hierarchy of the name of the layer and, underneath it, an identifier for the individual feature from that layer. The bottom of the pane shows the field (a column in a table) names and the attribute values (a row in a table) for the feature.
8. For the ‘Location’ attribute value, click the blank box which is currently blank or <Null>.
9. Type “Visitor Center” and press Enter.
This action stores the attribute values for that feature. Notice that the entry for the feature on the top of the pane is no longer a generic number but has been replaced with the more descriptive Visitor Center, as shown below.
10. Close the Attributes pane.
You have now completed the first exercise and created a new point feature. In the next exercises, you will learn how to create new lines and polygons.
11. On the Edit toolbar, in the Manage Edits group, click the Save button.
12. To stop creating new features, close the Create Features pane and click the Explore button on the Map toolbar in the Navigate group.
Exercise 1b: Digitizing lines and snapping
In the first exercise, you digitized a point over an aerial photograph; in this one, you will trace over the image to create a new line representing a road.
Because part of the road has already been created, you should use snapping to help ensure the new road feature connects to the existing roads. When snapping is turned on, your pointer will jump, or snap to, edges, vertices, and other geometric elements when it is near them. This enables you to position a feature easily in relation to the locations of other features. All the settings you need to work with snapping are located on the Snapping drop-down menu in the Edit toolbar.
Setting options for snapping
- Click the Map toolbar tab and click the Bookmarks menu to select the Digitizing roads bookmark.
The extent is just south of the point feature you created in the previous exercise. - On the Edit toolbar, click the Snapping pull-down menu and click the Snap icon to ensure that snapping is on (highlighted).
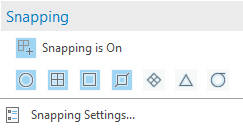
- Look on the Snapping drop-down menu and confirm that End
 , Vertex
  , and Edge
  snapping types are active. When enabled, the buttons are highlighted with a blue square. If they are not enabled, click each button to enable those agents.
 - Click the Snapping pull-down menu and select Snapping Settings…
From this dialog box, you can specify settings for snapping in ArcGIS Pro. - Ensure the XY tolerance is at least 10 Pixels.
The snapping tolerance is the distance within which the pointer or a feature is snapped to another location. If the element being snapped to—such as a vertex or edge—is within the distance you set, the pointer automatically snaps to the location. - Click OK to close the Snapping Settings dialog box.
Digitizing a line
You are now ready to begin digitizing the new road.
- On the Edit toolbar, in the Features group, click the Create button.
- In the ‘Create Features’ pane, click the Local road line template, which is grouped under the Roads layer. This feature template was created for you and saved in the tutorial map document.
The list of available construction tools at the bottom of the pane changes to those used to create lines. Since the Line tool is the default tool for this template, it is activated automatically. - Rest your pointer over the endpoint of the existing line in the western portion of the map display, as indicated below, but do not click yet. Notice that the pointer icon changes to a square snap symbol and a SnapTip appears with the name of the layer (Roads) and the snap type (Endpoint) in use. You can zoom or pan closer if you need to do so.
- Click once on the Roads: Vertex.

You digitize, or sketch, a new line or polygon by defining the feature's shape. You see a preview with the actual symbology used for that feature, with vertices symbolized as green and red boxes.
4. Using the aerial photo as a guide, digitize the new line by clicking the map each place you want to add a vertex.

5. Once you have digitized the new line, snap to the end of the existing Roads feature and click to place a vertex there.
6. Press the F2 key, which finishes the sketch to turn your shape into an actual feature in the geodatabase. You can finish a sketch in one of several ways: pressing F2, double-clicking, or using the right-click shortcut menu or the pop-up Feature Construction toolbar.
In this exercise, you learned how to set up snapping and use it to help you digitize a new road that connects to existing roads.
Exercise 1c: Creating new feature templates
The Template Properties dialog box allows you to review and change the template settings. For example, you can rename a template, provide a description, set the default construction tool, and specify the attribute values that should be assigned to new features created with this template.
In the first exercises, you used feature templates that had their properties already set for you. Now, you are going to set the properties of a feature template for a polygon layer representing private landownership. Before you create features, you should review a template's properties to ensure they are set appropriately.
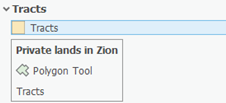
- In the ‘Create Features’ pane, click the Manage templates button to the right of the search bar.
- Select the Tracts layer under Exercise1, and then select the Tracts feature template in the bottom half of the Manage Templates pane and click Properties.

This opens the ‘Template Properties: Tracts’ window. - In the ‘Description:’ box, type “Private lands in Zion”. The description appears when you rest your pointer over a template in the ‘Create Features’ window.

You can also use tags to identify and help search for templates in the future. A tag representing the layer type—Polygon—is added automatically. - Click in the ‘Tags:’ box immediately after “Polygon”, type “; Zion; landownership”.
Ensure that there is a semicolon and a space between each tag. - Under the Tools tab, ensure that ‘Polygon Tool (Default Tool)’ is selected and turned on. If it is not, check the circle next to it.
This ensures that the Polygon tool activates each time you choose the Tracts template. - Under the Attributes tab, hover over the ‘Ownership’ field in the grid. System information about the field is listed at the bottom of the dialog box.
- To the right side of the ‘Ownership’ field, click the blank space or <Null> value to clear the text and type “Private”, which will assign the attribute value Private.
This sets Private as the default attribute value for that field for all new features created with this template.
- Click OK.
- Click the Create Features icon on the top-right of the Manage Templates window to return to creating features.

When you rest your pointer on the template, you see the text you entered for the description.
You are now ready to create features using the properties specified in this feature template.
Exercise 1d: Creating new polygon features
About creating polygons
Since you have been exposed to the basic concepts and user interface elements of editing and creating features, you are now ready to learn advanced feature creation techniques. You will use several different methods to construct the polygon tract boundaries, including snapping, entering measurements, and drawing rectangles. You also will use keyboard shortcuts and right-click menus to improve productivity while creating features.
When Zion National Park became a protected area in the early 1900s, multiple owners held the land that became the park. Although Zion is mostly United States federal government land now, there are some areas within the park that are still owned privately. In this exercise, you will create some boundary lines representing the privately held features.
Creating polygons using different construction methods
Choosing a template sets up the editing environment for the settings in that template. This action sets the target layer in which your new features will be stored, activates a feature construction tool at the bottom of the ‘Create Features’ window, and prepares to assign the default attributes to the new feature. Since the layer's template is set up so the Polygon tool is the default feature construction tool, the Polygon tool becomes active.
By default, the Line and Polygon tools create straight segments between the vertices you click. These tools also have additional ways to define a feature's shape, such as creating curved lines or tracing existing features. These are known as construction methods and are located on the Editor toolbar.
- In the Table of Contents, uncheck the World imagery layer to turn it off.
- Click the Bookmarks menu and select the Tracts bookmark.
- In the ‘Create Features’ window, click the Tracts template.
This activates the Polygon construction tool , which you set as the default tool using the Template Properties. Since the tracts share an edge with the park boundary and an adjacent tract, you can use them to help you construct the shape of the polygon.
 - On the Feature Construction mini toolbar, ensure the Line construction method is selected.

With the Line construction method, a vertex is placed each time you click, with the segments between vertices being straight lines. - Snap to the corner of the Zion park boundary polygon symbolized in light green, so that the SnapTip reads “Zion park boundary: Vertex” and click once.

- Move your pointer up (to the north), snap to the corner of the tract and the park boundary, so that the SnapTip reads “Tracts: Vertex”, then click again.
You now have created two vertices with a straight line connecting them to define the eastern boundary of this tract. - On your map display, hover over the bottom-right corner of the existing tract above so the SnapTip ‘Tracts: Vertex’ appears. Right-click your mouse and click ‘Direction’ and hit Enter.

This will lock your next point to be on the bottom edge of the existing tract. - Right-click and select ‘Distance’ and type 2600. Ensure the units is set to ft and press Enter.
The buttons to choose a segment construction method on the Feature Construction toolbar are also found on the Editor toolbar, but it is often easier to access them on the Feature Construction toolbar since it is closer to your pointer. If you click a segment construction method on the Feature Construction toolbar, it then becomes active on the Editor toolbar, and vice versa. Two of the most common segment construction methods, Straight Segment and Endpoint Arc Segment, are located directly on the toolbar, but there is a palette to the right of these buttons containing additional methods.
To enter the final measurement for the corner, you need to type a specific coordinate. - Right-click anywhere on the map and select Absolute X, Y….
Absolute XY allows you to type an exact x,y coordinate for the next vertex. By default, the values you enter are in map units, which are meters for this map. If you want to enter values in decimal degrees or other formats, you can click the arrow to change the input boxes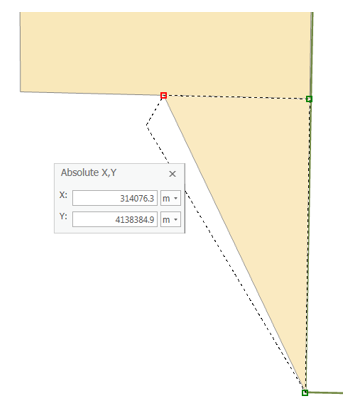
 Tip: If you make a mistake and want to cancel out of a sketch constraint, which is a command that limits the placement of the next vertex, you can press the ESC key. Once a vertex is added, you can delete it by pressing the Undo button
  on either the Feature Construction toolbar or the Standard toolbar.
 - For the ‘X:’ box, type “314076.3”.
- For the ‘Y:’ box, type “4138384.9”.
- Ensure the units are set to m and press Enter to automatically create a new vertex in the specified location.
- On the Feature Construction mini toolbar, click the Finish Sketch button.

You have created the first polygon lot feature. You could also use the F2 key, double-click the map, or right-click to finish the sketch. - On the Map toolbar, click the Explore tool.

- On the Map Display, click the new feature you just created.
Notice that the attribute value for the Ownership field is Private, which is the default value you set in the template's properties. - Close the ‘Identify’ pop-up window.
Creating rectangular polygons
Sometimes you need to create rectangular polygons. Rather than clicking each vertex individually as you have been doing, you can use the Rectangle construction tool. The first click with the Rectangle tool creates the first vertex, then the second click establishes the "angle" of the rectangle, and the final click adds the remaining corner vertices. In addition, the Rectangle tool allows you to enter x,y coordinates for the vertices, as well as directions and lengths for the sides.
- On the Map toolbar, click the Explore tool
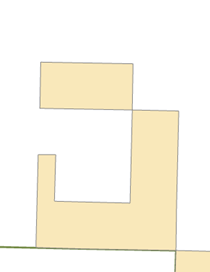
 and pan the map slightly to the west so the J-shaped polygon is centered in the display, as shown below.
 - In the ‘Create Features’ window, click the Tracts template, then the Rectangle tool,
 to make it the active construction tool.
 - Snap to the upper left corner of the J-shaped polygon, as shown below, and click to set the first corner of the rectangle.

- Right-click anywhere on the map and select Direction….
- Type “179” (as in 179 degrees), then press Enter.
This establishes the angle for the rectangle. As you move your pointer around the map, you see a rectangle preview of the feature. By default, angles are entered in degrees using the polar system, which is measured counterclockwise from the positive x-axis. You can specify a different direction measuring system or unit on the Editing Options dialog box > Units tab. - Right-click anywhere on the map and select Width….
- Type “400” to set a width of 400 meters, which are the map units, and press Enter.
- Move your pointer up and to the left so the rectangle is created in the correct position in relation to the existing feature, as shown above.
- Right-click and select Height….
- Type “800” to set a length of 800 meters and press Enter.
Creating adjoining polygons
You now need to create one more polygon to fill in the space between these two polygons. You could snap to every vertex, but an easier way is to use the Auto-Complete Polygon tool, which uses the geometry of existing polygons to create new adjacent polygons that do not overlap or have gaps.
- In the ‘Create Features’ window, click the Tracts template, then the Auto Complete Polygon tool
 to make it the active construction tool.
 - Snap to the lower left corner of the rectangle you just created and click.
- Move your pointer southward, snap to the corner of the original existing J-shaped polygon, as shown below, and click to add a vertex.

- On the Feature Construction mini toolbar, click the Finish Sketch button.

When using the Auto-Complete Polygon tool, ArcMap automatically uses the shapes of the surrounding polygons in that layer to create the geometry for the new polygon.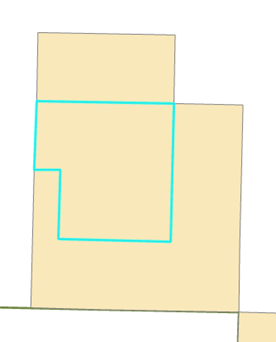
- On the Edit toolbar, click the Save button to save your edits.

- Click the Save button on the top-left of the window to save your map project.

The new features have been created with the default attribute values (Private) specified in the template. If you wanted to add other information, such as ID numbers, you would select the features and type the values into the ‘Attributes’ window.
Exercise 2
Exercise 2a: Defining new types of features to create
Sometimes you may want to create features of a certain type in an existing layer, but the layer is not set up to capture those features. For example, you want to add features to a roads layer to represent an unpaved road, but you currently only have categories in your data for freeway, major highway, and local road. Through a wizard, you can define everything about the unpaved road category at one time—making it easy to prepare your data to display and store the new types of features. ArcGIS Pro automatically adds a symbol for the new category, any required geodatabase information (such as subtype value or coded domain value) for that layer, and a feature template to use when creating an unpaved road. The wizard saves you from having to stop your work to open multiple dialog boxes to set up the data on your own.
The park contains several areas of natural, cultural, or historical significance that are designated for research and education purposes only and are not open for public recreational use. In this exercise, you will define a new category of features to represent buffer regions around areas in the park that have been proposed for research-only use. This new category can show the area where travel is not recommended but is not prohibited.
The Research areas layer is symbolized by unique values, so the Define New Feature Type wizard allows you to define the symbol and create a feature template containing the default attributes for the new buffer zones category. You will use an existing feature to create the new buffer around it in a later exercise.
- Above your map display, click the 02 Creating Features map.
- In the Table of Contents, select the Research areas layer and open the Create Features window in the Edit toolbar.
- Click the Manage Templates icon
 and select the Research_areas feature class from the list, under 02 Creating features.
 - In the lower menu, click the New drop-down menu and select Template...
The ‘New Template’ window opens. - In the ‘Name:’ box, type “Buffer zones”.
- In the ‘Description:’ box, type “Buffer zones around Zion research areas”.
- Select the Attributes tab from the left panel, and type “Buffer zone” next to the name field.
This will automatically populate the Name field of every feature you create with this template with “Buffer zones” - Click OK.
A new feature template has been created. - Notice that the ‘Create Features’ window lists a new feature template for the Buffer zones.
Now that you have added a feature template for the new type, you are ready to start creating features.
Exercise 2b: Creating features from existing features
Buffering features
You are provided with a polygon feature showing one of these research-only locations in the park and will use it to create another feature representing a buffer zone around it. You will select the original research-only polygon and use the Buffer command on the Edit menu to create the new feature.
When you click the Buffer command, a dialog box opens allowing you to specify a feature template and buffer distance. Like other measurements when editing, the buffer distance is specified in map units, but you can also give the value in other units by specifying a distance units abbreviation with the value that you enter.
Editing commands that create new features automatically from existing features, such as Buffer, require you to choose the feature template to use when creating the new feature. Similar to clicking a feature template in the Create Features window, choosing a template on these dialog boxes defines the layer where a feature will be stored and the default attributes for the new feature. A buffer feature can be created as either a line or a polygon, so you could see both line and polygon templates listed but no templates for any other types of features.
- Click the Bookmarks menu and select the Research-only area bookmark.
The map zooms to the Goose Creek area of the park. The polygons depict research-only areas. - In the Table of Contents, uncheck the Streams layer to turn it off.
This makes it easier for you to see and select the correct features. - On the Edit toolbar, click the Select tool.

- Select the southernmost Research areas polygon—the tan-colored one, as shown below.

- On the Edit toolbar, select Modify from the Features group.
This will open up the Modify Features window, which has a list of all the available tools. - Select Buffer from the Construct tools group.
- Select Buffer zones from the Template drop-down list.
The Select Feature Template window shows only templates that are valid output types for the particular command rather than all the templates listed on the Create Features window. In the case of Buffer, polygon and line templates would be listed, if available, since both these geometry types can store the new buffer feature. On the other hand, when using a command, such as Copy Parallel, that creates line features, only line feature templates are listed for that command. If you want to find a template by name, you can enter it into the <Search> box. - Next to ‘Buffer Distance’ type “300” and select m instead of the default ft.
This means a buffer will be created 300 meters (the map units) from the border of the selected polygon.
Click Buffer.
The new 300-meter polygon buffer feature is created using the properties of the Buffer zones feature template. The new feature is selected and is drawn on top of the existing feature.
In this exercise, you used an editing command, Buffer, to generate a feature from an existing feature
Exercise 2c: Editing polygon features
About editing polygons
In the previous exercise, the Buffer command created a feature that is the extent of the original feature plus the buffer distance. Since this feature should just be the buffer, you need to remove the shape of the original inner feature from the current buffer feature. You can use the Clip command on the Editor menu to cut a hole in the polygon feature.
You will also use the Cut Polygons tool to split a polygon by an overlapping line feature.
Cutting a hole in a polygon
The new feature is drawn on top of the existing one. To use Clip, you need to select the underlying existing feature. The Edit tool has special capabilities to help you select the correct feature from overlapping ones.
- On the Edit toolbar, click the Select tool.

- Click the center of the buffer feature.
Since there are multiple selectable features where you clicked, the selection chip may appear near where you just clicked. - Click the arrow to the right of the selection icon to view a list of the features from which you can select.

Features are listed in the selection chip by their display expression, which is set on the Layer Properties > Display tab.
- Rest your pointer over any feature in the list to flash it on the map.
- Click the Isolated Mesa Tops feature to select it.
You will use this feature to clip a hole in the Buffer zone polygon. The Clip command only clips polygon features that are within a buffer distance of a selected feature—in this case, the Isolated Mesa Tops research area. - Open the Modify Features window and select Clip from the Divide group.

- Ensure the ‘Buffer Distance:’ is 0.
This way, you will be clipping to the exact border of the selected feature rather than at a distance from it.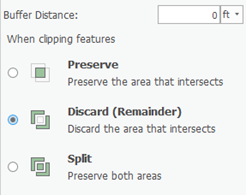
- Click Discard the area that intersects.
This removes the overlapping area from the feature that is being clipped. - Click Clip.
The overlapping area is clipped and now the original Research areas feature is visible through the hole in the buffer feature.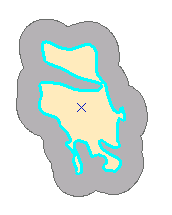
Since the buffer feature has a hole in it, its geometry is represented in ArcGIS as a multipart polygon. Multipart features either contain holes in them or are composed of more than one physical part that only references one set of attributes. For example, the individual islands that make up Hawaii are often represented as a multipart polygon feature.
Cutting a polygon
The neighboring research area needs to be divided into two polygons based on the river that runs through the middle. You can use the Cut Polygons tool to split the polygon.
To use the Cut Polygons tool, you need to select the polygon, then digitize a line where you want to cut the polygon. To change the shape of the line used to cut the polygon, click a construction method type on the Feature Construction mini toolbar. Segments can be created using a variety of methods, for example, as straight lines, with curves, or traced from the shapes of other features.
If you are cutting a polygon along a simple line, you can click to draw the line using the Straight Segment construction method. However, in this case, the river feature you want to use to cut with is long and curved, so it will be easier to trace around the border to create the line.
- On the Edit toolbar, click the Select tool.

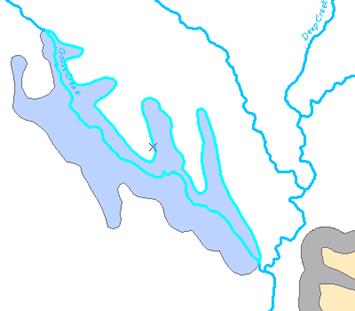
- Click the Goose Creek research area, the blue polygon just to the west of the polygons you were previously editing. You may need to zoom in or pan to this feature so you can see it better.
- In the Table of Contents, check the box to the left of the Streams layer to make the streams visible again so you can trace along them.
- On the Snapping drop-down menu, select Intersection Snapping.
This turns on snapping to intersections between features, which will help you ensure that the line used to cut the polygon starts and stops at the intersection of the polygon and line edges. - On the Edit toolbar, click the Split tool.

- On the Feature Construction mini toolbar, click Trace.

- Snap to the intersection of the polygon edge and the stream line nearest the buffer polygon you previous created, as indicated below, then click to start tracing the line through the polygon. Follow along the stream line to trace it.
You may need to zoom in to snap to the correct point.
Once you have traced all the way across the polygon, snap to the intersection of the polygon and the stream line at the northern edge of the polygon, and click the map to place a vertex, as shown below.

- Right-click anywhere on the map and select Finish Sketch.

You are finishing the sketch used to cut the polygon. The polygons flash on the map as the cut is made and the new features are selected. If an error occurs, ensure that you have the correct feature selected, try the trace again, then make sure your line goes completely across the polygon. It may help to zoom in when you start and end the trace.
On the Editor toolbar, click the Select tool.

- Click each new feature and notice that you now have two polygons.
- On the Edit toolbar, click Save.
In this exercise, you learned how to clip polygons and split them by tracing along an overlapping line feature.
Exercise 2d: Editing vertices and segments
In the previous exercise, you edited whole features. In this exercise, you will be editing the vertices and segments that make up a feature. You can double-click a feature with the Edit tool to edit its shape. When you do this, the Edit tool pointer changes from a black arrow to a white arrow to show you can directly select vertices and modify segments.
The Edit Vertices mini toolbar provides quick access to some of the most commonly used commands when editing vertices. It appears on the bottom-center of the screen whenever either the Edit tool or the Topology Edit tool is active and you are editing the vertices of a feature or topology edge. You will drag the vertices and handles to edit the shape of a line that was poorly digitized on a trailhead that starts at a road and ends near a stream.
- Above your map display, click the 03 Editing Features map.
- Click the Bookmarks drop-down menu on the Map toolbar and select the Trail bookmark.
- Click the Edit toolbar and click the Select tool.
- Select the trail line (the brown and gray dashed line) that connects to the road.
- On the Edit toolbar, click the Vertices tool.

When you are viewing the sketch geometry of a feature, the Edit Vertices toolbar appears, giving you quick access to commands used when editing a feature's vertices and segments.
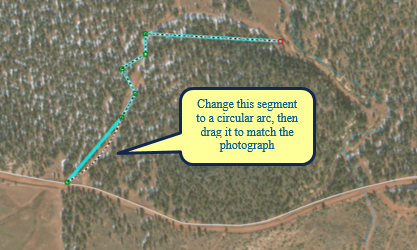
When compared to the aerial photograph, notice that this line is straight when it should be curved, and it also has some extra vertices. You can easily change a straight segment into a circular arc or Bézier curve, and vice versa, and delete the extra vertices. A Bézier curve is smooth and has on each of its two endpoints handles that can be moved to change the direction and the steepness of the curve. You can create Bézier curves by digitizing them using the Bézier Curve sketch construction method or by using certain editing commands, such as Smooth on the Advanced Editing toolbar. - Move your pointer over the middle of the trail line segment closest to the road, as shown below, and notice that the pointer changes to indicate you are working with a segment.
- Right-click the middle of the trail line segment and selectChange Segment > Circular Arc.
The segment changes to an arc. - Click, drag, and drop the arc over the trail on the aerial photograph. You can hold down the SPACEBAR key to turn off snapping temporarily if you are having difficulty placing the curve where you want it, because it is snapping to its original location.
- Click the map away from the new line feature to update its shape.
- Double-click the trail line feature, which accomplishes the same thing as using the Edit Vertices button.
- On the Edit Vertices mini toolbar, click the Delete Vertex tool.

- Draw a circle around the three vertices that form a zigzag shape between the previous segment and the horizontal segment, as shown below.
This deletes those vertices, as they are in the incorrect locations and are not needed to maintain the shape of the line in this area.
- On the Edit Vertices toolbar, click the Normal Vertices tool
 (the white Edit tool).
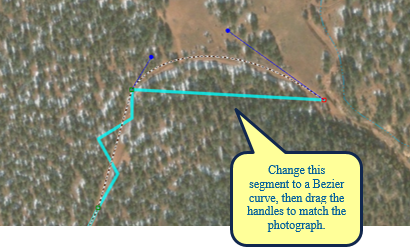
This allows you to continue working with the segments and vertices. - Right-click the northernmost trail line segment and selectChange Segment > To Bézier Curve.
A new set of Bézier curve handles is added, and the segment changes into an S-shaped curve. You can see the locations of the vertices and handles, which are displayed in blue. - Rest your pointer over a green vertex, then rest it over a blue handle.
You get different pointer icons depending on the type of point you are over. - Drag the blue handles to reshape the curve to match the aerial photograph, as shown below.
- Click the map away from the trail line feature to update the changes to its shape.
If you need to refine the line's shape further, double-click it again with the Edit tool and modify the segments. If you want to insert or delete a vertex, use the tools on the Edit Vertices toolbar.
- On the Edit toolbar, click Save.

- You changed segments into different types and edited vertices.