...
- Click the More drop-down menu to the top right of the Upper value table.
- Under Symbols, click Format all symbols.

- At the top of the pane, note how Gallery is selected by default. Select Properties.
- Expand the Appearance drop-down section.
- Click on the color box associated with Outline color.
- Hover over the colors until the labels appear, and select Gray 80%.
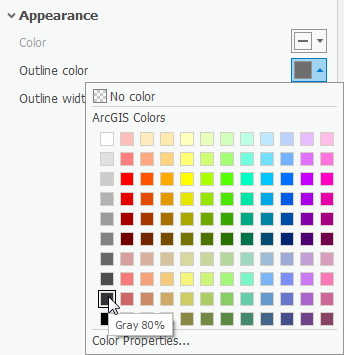
- Click on the color box associated with the Outline color again.
- At the bottom of the pane, select Color Properties...
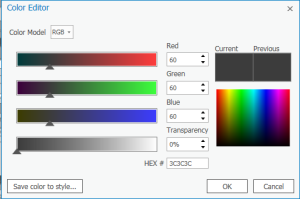
- In the pop-up Color Editor box, change the Red, Green, and Blue values to 60.
- Make sure the HEX # is 3C3C3C and click OK.
- Change the Outline width to 0.5 pt.
- At the bottom of the pane, click Apply.
...
- On the Insert ribbon, click the Map Frame title with the drop-down arrow.
- Select the frame that contains the "Median H..." name.

- Right-click the 0" mark on the horizontal ruler at the top of the Layout. Select Add Guide.
- At the 5" mark on the horizontal ruler, right-click and select Add Guide.
- Repeat at the 0" and 4" marks on the vertical ruler.
- Select the Map Frame in the center of the Layout. Click and drag the corners to snap to the guides on the corner of the Layout.
- In the Contents pane to the left, expand the Map Frame layer. Expand the original map Median Household Income by Census Block Group layer.
- Right-click on the BlockGroupCensusData layer and select Zoom To Layer.
...
- Move the North Arrow to the lower right corner of the map.
- In the Contents pane, click on the North Arrow layer. The Format North Arrow pane pops up on the right.
- Under the North Arrow drop-down menu, select Point Symbol.
- Click the color box associated with the Color field. Select Gray 50%. Click Apply.

- In the Insert ribbon, in the Map Surrounds group, click the Scale Bar drop-down menu.
- Select Alternating Scale Bar 1.
- Drag the scale bar down to the middle bottom of your layout. Resize the scale bar until you can see the numbers clearly.
- Notice that the Format Scale Bar pane has popped up to the right. Instead of Scale Bar, select Text Symbol to the top.
- Under Size, choose 8 pt. Under the Color box, choose Gray 50%. At the bottom, click Apply.
- Click the Scale Bar drop-down menu. Select Background. Under Outline Color, right-click the associated color box and choose Gray 50%.
- Click the Scale Bar drop-down menu. Repeat changing the colors to Gray 50% for the Background, Shadow, Numbers, Units, Symbol 1, and Symbol 2.
- In the Contents pane to the left, click the Map Frame layer.
- In the Format Map Frame pane to the right, click the Map Frame drop-down menu. Select Border.
- Change the Color to No color and select Apply.
...
- In the Insert ribbon, in the Map Surrounds group, click Legend.
- Drag and release a large rectangle around the blank space at the bottom of the map to place the Legend.

- In the Contents pane, click on the Legend layer.
- In the Format Legend pane to the right, under the Legend Items section, click the Show properties... button.
- Under the Show list, uncheck Layer name.
- Resize the Legend box so that it fits in the space provided.

- If you are still in the Format Legend Item pane, click the top left back arrow in the pane.
- Under the Legend drop-down menu, select Headings. Expand Appearance.
- Change the Color to Gray 80% and click Apply.
- Under the Legend drop-down menu, select Labels.
- Change the Color to Gray 80% and click Apply.
...
- In the Share ribbon, in the Export Group, click the Layout button with the green arrow.

- Navigate to your LayoutTutorialData folder on the Desktop.
- Make sure the Save as type is TIFF (*.tif) and the Resolution (DPI) is set to 600.
- Click Export.
...