...
- In Geoprocessing pane, click the Spatial Analyst Tools toolbox, click the Map Algebra toolset, click the Raster Calculator tool.
- In the list of ‘Layers and variables’‘Rasters’, double-click the DEMSubbasin layer.
- In the calculator, double-click the * button.
- In the equation box, type “3.281”, which is the conversion factor from meters to feet.
- For ‘Output raster’, rename the raster from “rastercalc” to “DEMft”.
- Ensure your ‘Raster Calculator’ window appears as shown below and click Run.

...
- Again, go back to the Raster Calculator tool. Delete the previous expression.
- In the list of ‘Layers and variables’'Rasters’, double-click the DEMft layer.
- In the calculator, double-click the <= button.
- In the equation box, type “15”.
- For ‘Output raster’, rename the raster from “demft_raster” to “Flood15ft”.
- Ensure your ‘Raster Calculator’ window appears as shown below and click Run.

...
- In a web browser, go to www.ncdc.noaa.gov/cdo-web/.
- Click the Mapping Tool tab.
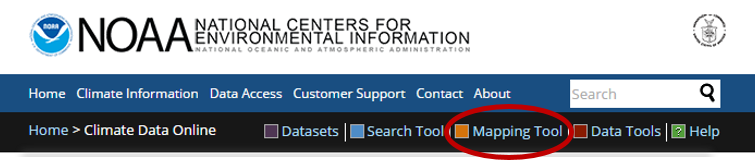
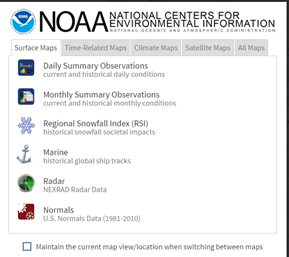
You will search for data using the NHD hydrologic units. Previously, you had been working with the Buffalo-San Jacinto subbasin (HUC = 12040104). In this case, you will step up two levels to the Galveston Bay-San Jacinto subregion (HUC = 1204). - On the Surface Maps tab, click Normals
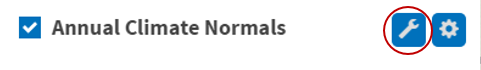
- In the left sidebar, on the Layers tab, uncheck Daily Climate Normals, and check Annual Climate Normals.
- To the right of Annual Climate Normals, click the Map Tools button.
- In the new ‘ANNUAL CLIMATE NORMALS TOOLS’ window, click Location.
- Use the drop-down menu to select USGS HUC.
- Use the ‘Select a HUC type’ drop-down menu to select Subregions (4-digit).
- Use the ‘Select a HUC’ drop-down menu to select Galveston Bay-San Jacinto.

- Click Zoom to location.
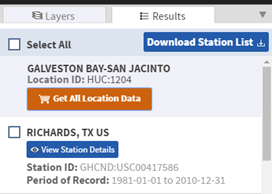
- The left sidebar switches to the Results tab. Click Get All Location Data.
- For Step 1, select CSV for the output format and click CONTINUE.

- For ‘Station Detail & Data Flag Options’, check Station name, Geographic location, and Include data flags to include those variables the data table.

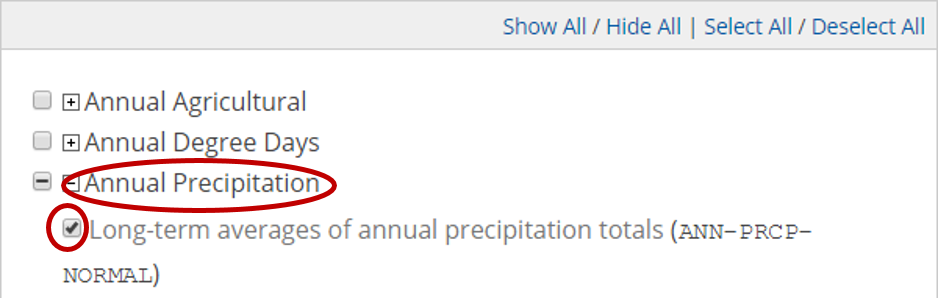
- For ‘Select data types for custom output’, click the Annual Precipitation category to expand it.
- Check Long-term averages of annual precipitation totals (ANN-PRCP-NORMAL).
- At the bottom of the window, click CONTINUE.
- Type your email address twice and click SUBMIT ORDER.
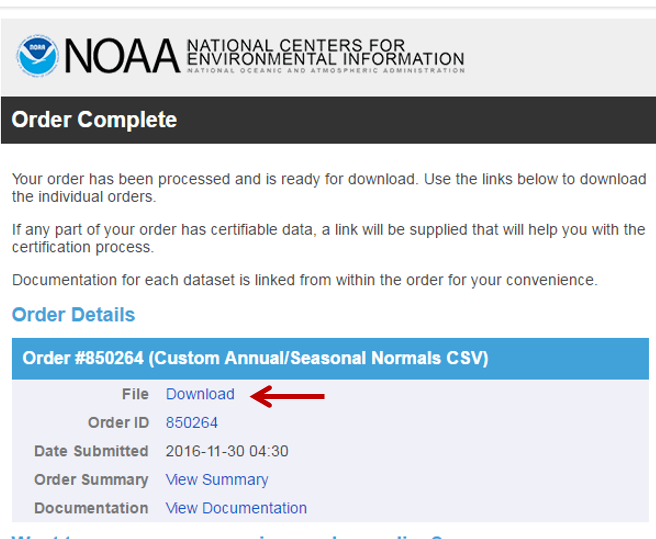
Check your email. You should receive two emails a couple minutes apart, although it may take a few hours to receive the second email. The first one indicates that your data request was submitted and the second one includes the requested data. - In your email, click the Download link to download the requested CSV file.
...