...
- On the Standard toolbar, click the Insert tab and click New Map.


- At the top of the Contents pane, rename the map to "Lab2".
...
Notice that the layer is now in a projected coordinate system, NAD 1983 StatePlane Texas S Central FIPS 4204 (US Feet).
- Close the ‘Layer Properties’ window.
...
Move the cursor around the screen and notice that the coordinates at the bottom of the map view are shown in decimal degrees. This is another clue that the data frame is still using a geographic coordinate system; however, you would like the data frame to display data using the local Houston projection.
At the top of the Contents pane, double-click the Lab 2 map to open the 'Map Properties' window.
- Click the Coordinate Systems tab.
While you could search for or navigate to the State Plane Texas South Central projection, as you did before, in this case, you know that the same coordinate system is already used by the Watersheds_StatePlane layer. In such an instance, it is often easier to import the coordinate system from another known layer, especially if you are not familiar with the hierarchy of the coordinate system folders
Scroll to the top of the 'XY Coordinate Systems Available' list.
Expand Layers.
...
Click NAD 1983 StatePlane Texas S Central FIPS 4204 (US Feet).
- Click OK.
Notice that the watershed boundaries are now more compact in the east-west direction, as expected, because the local projection results in less distortion than the
...
pseudo plate carrée projection used to represent geographic coordinate systems.
Part 2: Downloading DEM Data
...
Now you are ready to download digital elevation model (DEM) data for the Buffalo-San Jacinto subbasin. Some local government agencies, such as the Houston-Galveston Area Council Council (H-GAC) contract to have LiDAR data collected, which provides high resolution data containing both the elevation of the bare land and the heights of features in the built environment. Though we are lucky to have this high-quality data available in this particular region, for projects anywhere in the U.S., the best available DEM data generally comes from the National Elevation Dataset (NED) produced by the USGS. More information regarding NED data can be found at ned.usgs.gov. You will download NED data from The National Map ViewerDownload Client.
- In a web browser, go to https://viewerapps.nationalmap.gov/basicdownloader/.
First, you will select the data products you are interested in viewing and downloading.
- On the left side bar, under the 'Data' section, check the ElevationProducts Elevation Products (3DEP) section to expand it.
- Within the Product Search FilterIf necessary, within the 'Subcategories' section, check1/3 arc-second DEM for the subcategory and selectArcGrid for the File Format.
Notice that GeoTIFF, IMG is the only file format available for this type of data.
- On the left side bar, scroll below the Elevation Products section and check the Hydrography (NHDPlus HR, NHD, WBD) section to expand it.
- Within the Product Search Filter, select National Hydrography Dataset (NHD) for the subcategory, selectHU-8 Subbasin for the Data Extent and selectFileGDB10.1 for the File Format.
Now you constrain your downloads to your area of interest. - In the search bar just above the map on the right, type “Houston” and clickGo.
After zooming into Houston, you can see the blue boundaries of the individual subbasins and each subbasin is labeled with its HUC-8 number on the map.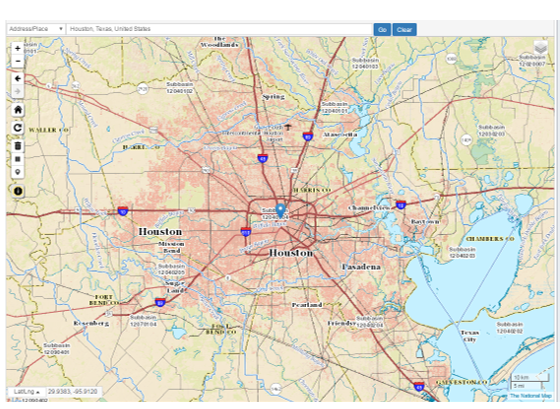
- Near the center of the map, click within Subbasin 12040104 to select it.

Notice that just above the map, your search is now constrained to Polygon: huc8 12040104. - At the top of the left side bar, clickFindProducts.

- Under Available Products, to the right of Elevation Products (3DEP), clickresults.
You are now provided with a listing of all the DEM tiles covering the area of Subbasin 12040104.
- In turn, click Download for USGS NED n30w096, n30w095, and n31w096.

- Navigate to the location where the three zipped folders have been downloaded.
- Select and copyall three zipped folders.
- Using Windows Explorer, navigate to your HydrologyLab folder.
- Paste all three zipped folders directly inside your HydrologyLab folder. Do NOT paste them inside the .gdb geodatabase.
- Select all three zipped folders.
- Right-click any of the three selected folders and select7-Zip → Extract to “*\”, which will create one unzipped folder for the contents of each zipped folder.
- Return to ArcGIS Pro.
...