...
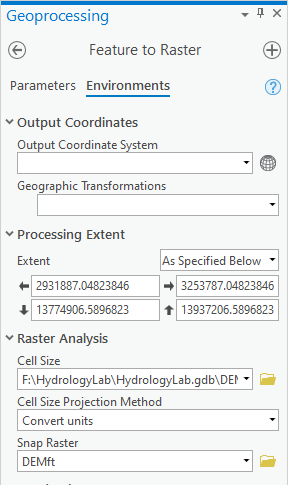
Notice that the familiar State Plane Texas South Central projection is now listed. Because both the input and output coordinate systems are based on the NAD 1983 geographic coordinate system, no geographic transformation is required.
- Ensure your ‘Project’ window your Geoprocessing pane appears as shown below and click Run.

...
- Under the 'Raster Analysis' section, use the for ‘Cell Size’ drop-down menu to , select the Same as layer DEMft.
- Use the For ‘Snap Raster’ drop-down menu to , select the DEMft raster.
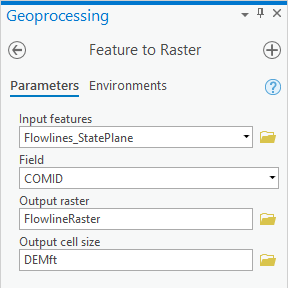
- At the top of the Geoprocessing window, click the Parameters tab on the left.
- Ensure your ‘Feature to Raster’ window Geoprocessing pane appears as shown below and click Run.
- In the Contents pane, uncheck the Subbasin_StatePlane layer.
If you zoom in closely, you will notice the raster cells intersecting the Flowlines_StatePlane layer have been added to the FlowlineRaster layer and are assigned a color.

- Symbolize the FlowlineRaster layer using Unique Values based on the COMID values stored in the Value field, so you can see how the COMID values have been assigned to the cells.

- In the Contents pane, collapse the FlowlineRaster symbology.
...
You currently have a raster where each cell contains either the COMID value or the value NoData. NoData cells are transparent, hence you can still see the DEMft layer beneath them. Ideally, you would like a raster where all the flowline cells are assigned a value of 1 to use as a simple flag.
...
.
- Return to the Geoprocessing pane.
- At the top left of the Geoprocessing pane, click the Back button.
- In the search box, type "greater".
- Click the Greater Than (Spatial Analyst Tools) tool.
...
- For ‘Input raster or constant value 1’, select the FlowlineRaster layer.
- For ‘Input raster or constant value 2’, type “1”.
- For ‘Output raster’, rename the raster from “Greater_Flow1” to “FlowlineBinary”.
- Ensure your ‘Greater Than’ window Geoprocessing pane appears as shown below and click Run.


The resulting raster assigns each cell a value of 1 when it intersects with a flowline and a value of NoData when it does not intersect a flowline.
...
- At the top left of the Geoprocessing pane, click the Back button.
- In the search box, type "reclassify".
- Click the Reclassify tool (Spatial Analyst) tool.
- For ‘Input raster’, select the FlowlineBinary layer.
- For ‘Reclass field’, select the Value field.
In the ‘Reclassification’ table, you will see a list of old values and new values. You would like to maintain all old values of 1, but you would like to assign all old values of NoData NODATA to a new value of 0.
- In the New values column, replace the “NoData” “NODATA” value with a value of “0”.
- For ‘Output raster’, rename the raster from “Reclass_Flow1” to “Reclassify”.
- At the top of the Geoprocessing window, click the Environments tab on the right.
- For Under the 'Processing Extent' section, for 'Extent', select Same As layer: DEMft.
- Under the 'Raster Analysis' section, for ‘Cell Size’, select Same as layer DEMft.
- For ‘Snap Raster’, select the DEMft raster, use the ‘Extent’ drop-down menu to select Same as layer DEMft.Use the ‘Snap Raster’ drop-down menu to select the DEMft raster.
- Ensure your ‘Reclassify’ window appears as shown below and click Run.

...