...
The resulting raster assigns each cell a value of 1 when it intersects with a flowline and a value of NoData when it does not intersect a flowline.

Reclassifying a raster
Though you now have a uniform value of 1 to flag the presence of a flowline cell, the remaining cells have a value of NoData, which is not useful for performing mathematical operations across all the cells, so you would like to reassign all cells with a value of NoData to a value of 0.
...
Now all cells that were previously assigned a value of NoData within the subbasin geometry have been assigned a value of 0. This will allow you to perform uniform mathematical operations across the entire subbasin in the future.

Calculating Euclidean distances
...
- At the top left of the Geoprocessing pane, click the Back button.
- In the search box, type "fill".
- Click the Fill tool.
- For ‘Input surface raster’, select the DEMRecon layer.
- For ‘Output surface raster’, rename the raster from “Fill_DEMReco1” to “FIL”.
- Ensure your Geoprocessing pane appears as shown below and click Run.


Calculating flow direction
Now you will calculate the cardinal direction in which water from each cell is expected to flow based on the elevations of surrounding cells. Each direction is assigned one of 8 integer values between 1 and 128 as indicated in the illustration below.

- At the top left of the Geoprocessing pane, click the Back button.
- In the search box, type "flow".
- Click the Flow Direction tool.
- For ‘Input surface raster’, select the FIL layer.
- For ‘Output flow direction raster’, rename the raster from “FlowDir_FiIL1” to “FDR”.
- Ensure your Geoprocessing pane appears as shown below and clickRun.

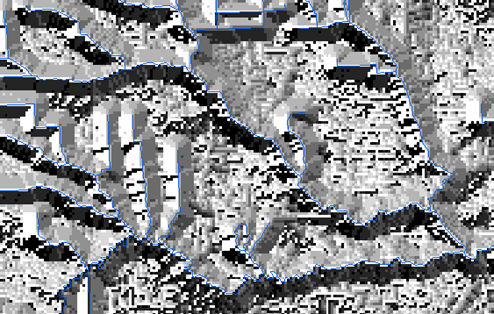
The result may appear a bit strange at first, due to the color scheme assigned to each cardinal direction.
Symbolize the FDR layer using Unique Values with a smooth black and white gradient for the Color Scheme.
You will notice the layer now looks similar to a hillshade.
Calculating flow accumulation
Finally, you will calculate flow accumulation in each cell as illustrated below. Flow accumulation is dependent on the flow direction you calculated previously.

- At the top left of the Geoprocessing pane, click the Back button.
- In the search box, type "flow".
- Click the Flow Accumulation tool.
- For ‘Input flow direction raster’, select the FDR layer.
- For ‘Output accumulation raster’, rename the raster from “FlowAcc_FDR1” to “FAC”.
- Ensure your Geoprocessing pane appears as shown below and clickRun.

- Turn off the Flowlines_StatePlane layer to better see the FAC layer.
- Right-click the FAC layer and click the Symbology.
- For ‘Symbology’, use drop-down menu to selectClassify.
- In the ‘Method’ drop-down menu to select Equal Interval.
- Use the ‘Classes’ drop-down menu to select8 classes.
- For ‘Class Breaks’, double-click the numbers in the Upper Value column and typethe following list: 100, 300, 1000, 3000, 10000, 30000, 100000. (Leave the final max value, 351408 as is.)
- Use the ‘Color Ramp’ drop-down menu to select the multipart color scheme.


Visually trace along the streams until you find the darkest path exiting the watershed. Notice that, according to the model you have just generated, the Buffalo-San Jacinto basin drains north into Lake Houston, instead of south into Galveston Bay. Look for the exact point on the map where this divergence is created. It is circled in the image below. A problem is that the topography in that area is extremely flat and, rather than a single well-defined channel, there are wide bodies of water connecting the bayous to Galveston Bay. Calculating the flow accumulation more accurately would require further editing the base raster so that the wide flat bodies of water are not treated as narrow flowlines. This example also illustrates how you must always double-check the results of your models to ensure they make sense. For the purposes of learning the remaining geoprocessing tools in this lab, you will continue with the existing flow accumulation model, as if it was correct.
...