October 24, 2019 - This tutorial is still being actively edited. Please wait for this message to disappear before completing or printing, if you'd like to view it in its final form.
This guide was created by the staff of the GIS/Data Center at Rice University and is to be used for individual educational purposes only. The steps outlined in this guide require access to ArcGIS Pro software and data that is available both online and at Fondren Library.
The following text styles are used throughout the guide:
Explanatory text appears in a regular font.
- Instruction text is numbered.
- Required actions are underlined.
- Objects of the actions are in bold.
Folder and file names are in italics.
Names of Programs, Windows, Panes, Views, or Buttons are Capitalized.
'Names of windows or entry fields are in single quotation marks.'
"Text to be typed appears in double quotation marks."
Obtaining the Tutorial Data
Before beginning the tutorial, you will copy all of the required tutorial data onto your Desktop. Option 1 is best if you are completing this tutorial in one of our short courses or from the GIS/Data Center and Option 2 is best if you are completing the tutorial from your own computer.
OPTION 1: Accessing tutorial data from Fondren Library using the gistrain profile
If you are completing this tutorial from a public computer in Fondren Library and are logged on using the gistrain profile, follow the instructions below:
- On the Desktop, double-click the Computer icon > gisdata (\\file-rnas.rice.edu) (O:) > Short_Courses > Demographic_and_Business_Data_Series > Bringing_Census_Data_Into_ArcGIS > BringingCensusData
- To create a personal copy of the tutorial data, drag the BringingCensusData folder onto the Desktop.
- Close all windows.
OPTION 2: Accessing tutorial data online using a personal computer
If you are completing this tutorial from a personal computer, you will need to download the tutorial data online by following the instructions below:
Tutorial Data Download
- BringingCensusData
- Click BringingCensusData.zip above to download the tutorial data.
- Open the Downloads folder.
- Right-click BringingCensusData.zip and select Extract All....
- In the 'Extract Compressed (Zipped) Folders' window, accept the default location into the Downloads folder and click Extract.
- Drag the unzipped BringingCensusData folder onto your Desktop.
- Close all windows.
Tabular Data
Explore Data
The folder you downloaded contains an unprocessed data table that appear as it would if you downloaded it directly from the web site.
- Open the Excel document titled AmericanFactFinderDownload.csv.
This data would require a lot of reformatting. The many layers of headers must be condensed because ArcGIS can only read one header row containing field names. There are several identifying columns containing duplicate information, but only the second column presents the ID in a way we want to use.
- Open SimplyMapDownload.csv.
This data is nearly ready to use. A few of the field names need updating to include only alphanumeric characters and underscores (# and spaces, for example, are not allowed). The column widths also need to be resized to display all the cell contents.
- Open SocialExplorerDownload.csv.
This data is not ready to use, but it does not require extensive reformatting. We will use this table as an example.
- Close both AmericanFactFinderDownload.csv and SimplyMapDownload.csv.
For ArcGIS to be able to read your table, it must be formatted appropriately.
- Select Columns A though AB in the SocialExplorerDownload.csv table by clicking on the gray area in the top-left hand corner of the table. Double-click on the line between any two columns to resize the column widths. All cell contents should be visible.
- Delete unneeded columns:
- The identifying fields repeat information that we don’t need. Delete Area Name-Legal/Statistical Area Description, Qualifying Name, Summary Level, Geographic Component, State (FIPS), County, County Size Code, County Subdivision, and Census Tract. Be sure to keep FIPS.
- Delete the copy of Total Population.
- Delete all columns after Total Population: Hispanic or Latino.
- Rename the field names with the following criteria: Remove all spaces and special characters, must begin with a letter, fewer than 64 characters. Keep FIPS as it is. TotalPop. NonHispanic. White.etc
- Delete Row 2 with “SE_T055_001”

- Click File > Save As. Select the BringingCensusData folder.
- Under ‘Save as type:’ select the top option, ‘Excel Workbook (*.xlsx)’. Click Save.
Geographic Features
A Shapefile is a digital vector storage format for storing geometric location and associated attribute information.
Downloading TIGER/Line
We will obtain our geography from the Census Bureau.
- Open a web browser. Search for “TIGER/Line.”
- Select the first option for Census.gov.
- Navigate to the 2010 TIGER/Line Shapefiles.
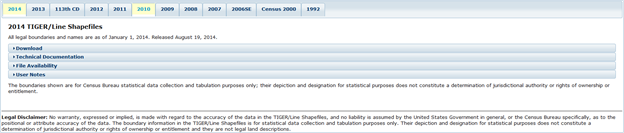
- Click on the Download tray to expand it.
- Under Download by File Type, select Web Interface.
- For ‘Select year’, choose 2010.
- For ‘Select a layer type’, choose Census Tracts. Click Submit.
- Under Census Tract (2010) ‘Select a State’, select Texas.
- Under ‘Select a County’, select Harris County. Click Download. tl_2010_48201_tract10.zip will begin to download.
Unzip
Before ArcGIS can read the files, we must extract from the zipped folder.
- In the lower left corner of Chrome, select the arrow next to the downloaded file and click ‘Show in folder’.
- Right-click on the zip folder and select ‘Extract All…’Navigate to your BringingCensusData folder and select Extract.
Bring into ArcGIS Pro
Adding Files
- In the BringingCensusData folder, double-click BringingCensusData.aprx to open your project.
- In the Catalog pane to the right of the Map Window, double-click the Folders folder. Double-click BringingCensusData.
Notice the TIGER/Line shapefile is one item, while viewing it on the Windows menu it had been six. ArcGIS automatically reads shapefiles as one document.
- Click the TIGER/Line shapefile you downloaded, ‘tl_2010_48201_tract10.shp’, and drag it into the Map Window.
Importing Excel sheets into ArcGIS will only allow the sheets to be viewed and not edited. This will become important in later steps. In order to import a fully editable table, we must create one with a Tool.
- In the Analysis tab, select the Tools button. In the Find Tools search bar in the Geoprocessing pane, type ‘Excel to Table.’ Select Excel To Table (Conversion Tools).
- For the ‘Input Excel File’, click the Browse button and navigate to your BringingCensusData folder. Single-click on the SocialExplorerDownload.xlsx and click Open.
- For the ‘Output Table’, rename it ‘SocialExplorerDownload.’ Make sure your window looks like the window below and select Run.

Format Tables
Append data from your table to your geography.
- Right-click the Shapefile and select Attribute Table. Take note of the field which contains the unique identifier on which your join will be based. In this case the field is GEOID10. Hover over the GEOID10column header and notice that the Type of the field is Text.
- In the Contents pane, right-click SocialExplorerDownload and select Open. Notice the name of the field that matches the shapefile’s field. In this table, it is named FIPS. Hover over the FIPS title and notice that the Type of the field is Double. This is not compatible with the Text field of the shapefile.
- In the Contents pane, right-click the SocialExplorerDownload table and select Design > Fields.
- Scroll to the bottom of the fields list and click on the ‘Click here to add a new field.’
- For the Field Name, type in FIPS_Text. Change the Data Type to Text. In the Data tab, click the Save button.
- In the Contents pane, right-click the SocialExplorerDownload table and select Open. Scroll all the way to the right. Right-click on the FIPS_Text header and select Calculate Field.
- In the Geoprocessing pane, under the Fields menu, double-click FIPS. Notice that the smart code reads ‘FIPS_Text = !FIPS!’. When your window looks like the window below, select Run.

Join
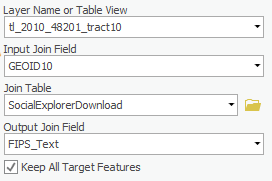
- In the Contents pane, right-click on the Shapefile. Under Joins and Relates, select Add Join.

- In the Geoprocessing pane, notice the “Input Join Field” drop-down menu. Select GEOID10. ArcGIS Pro has automatically selected the SocialExplorerDownload for the “Join Table”. Under “Output Join Field”, select FIPS_Text. Ensure your window looks like the window below and select Run.
- In the Contents pane, right-click the Shapefile and select Attribute Table. Scroll to the right and notice the census data has been appended to the fields.
- In the Contents pane, right-click the Shapefile and select Data > Export Features. In the Geoprocessing pane, rename the Output Feature Class CensusTractData. When your window looks like the window below, select Run.

Symbolize
Explore the patterns in your data or create a layout to share.
- In the Contents pane, right-click CensusTractData and select Symbology. The Symbology pane will open to the right of the Map Window.
By default, all features are symbolized on a Single Symbol. Since this data represents continuous numeric values, it should be represented as Quantities.
- Under the Symbology drop-down menu, select Graduated Colors.
- In the Field drop-down menu, select ‘Hispanic’.
- In the Normalization drop-down menu, select ALAND10.
This setting normalizes the population of Hispanic people by land area to adjust for large and small census tracts.

- Change the Normalization selection to TotalPop. The data now shows the Hispanic population as a percentage of the total population, accounting for heavily populated tracts.