...
The general type of projection is Lambert Conformal Conic, but its properties (central meridian, standard parallels, latitude of origin, etc.) have been modified to be optimal for South Central Texas. These modifications are saved under the Projected Coordinate System name NAD 1983 StatePlane Texas South Central FIPS 4204 Feet. The State Plane projection system divides each state into multiple planes, or zones, following county boundaries that are suitable for mapping local regions within each state. Houston falls within the South Central plane in Texas.
Finally, notice that the linear unit for this projection is US Survey Feet, which means that the XY coordinates for the data are recorded in feet.
- In the ‘Layer Properties: MajorRoads’ window, click Cancel.
- In the Contents pane, double-click the Schools layer name to open the 'Layer Properties' window.
- On the left, ensure the Source tab is still selected and expand the Spatial Reference section.
...
- Near the top of the Contents pane, double-click Map to open the 'Map Properties' window.
- On the left, click the Coordinate Systems tab.
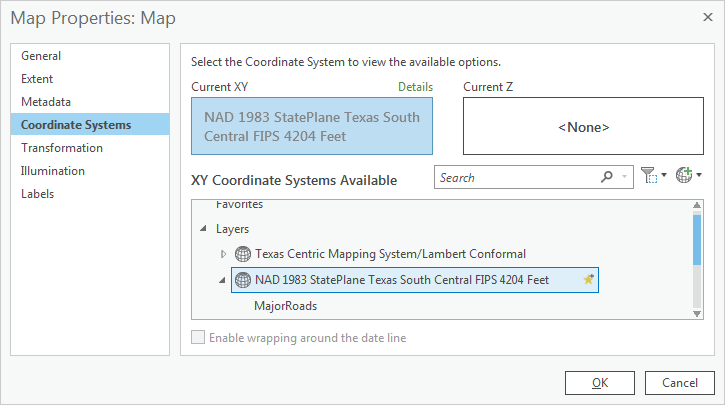
Notice that, indeed, the State Plane Texas South Central projection is listed.
(insert image)
- In the ‘Map Properties: Map’ window, click Cancel.
- In the Contents pane, right-click the MajorRoads layer and select Zoom to To Layer.
Notice that both the MajorRoads layer and the Schools layer appear to line up properly, even though they have different projections. This is because ArcGIS is able to perform “onon-the-fly” fly projection, as long as the coordinate systems of both layers are defined. On-the-fly projection means that the Schools layer is being superficially displayed in the State Plane Texas South Central projection of the data framemap, based on calculations performed by ArcGIS; however, the projection of the Schools feature class itself has not been altered from the Texas Centric Mapping System projection.
...
- In the Contents pane, right-click on the the County layer and select Zoom to To Layer.
Notice that the County layer does not appear on where it should on the Mapmap. If you zoom out far enough, you will see that it is in the middle of the Pacific Ocean. This is because ArcGIS does not know where to locate the County layer relative to the other layers, since it is not defined. Instead, ArcGIS does the best it can and treats the coordinates of the County layer as if they were in Texas South Central State Plane coordinates, even though they are not.
- In the Contents pane, right-click on the the MajorRoads layer and select Zoom to Layer.To Layer.
Notice when you move your cursor around the map, the coordinates listed in the bottom of the map view are similar to those shown below, indicating that Houston is located at 95°W, 29°N.

While those coordinates are being displayed for general reference purposes, recall that the XY coordinates for data in the State Plane projection is actually stored in feet. You will now change your map view to display units in feet, so that you can see the actual XY coordinates stored in your data.
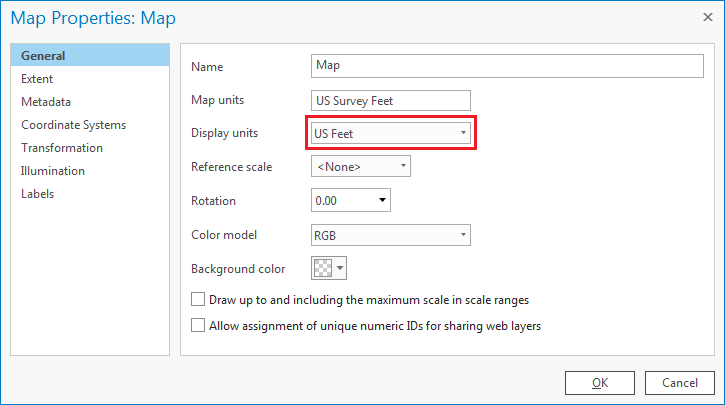
- Double-click Double-click Map to open the 'Map Properties' window.
- Ensure On the left, click the General tab is selected.
Notice that the 'Map units' are listed as Foot US, but the 'Display units' are in feet. We will listed as Decimal Degrees. You will now make the display units match the map units.
- Use the 'Display units' drop-down menu to select US Feet and click OK.
Notice when you move your cursor around the map display, the coordinates listed in the bottom right of the window are similar to those shown below, indicating units of millions of feet.

- In the Table of Contents, right-click the County layer and select Zoom to Layer.
...