...
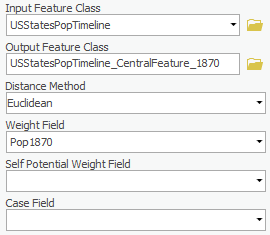
- For ‘Output Feature Class’, rename the feature class "USStatesPopTimeline_CentralFeature_1870".
- For ‘Weight Field,’ use the drop-down menu to select the Pop1870 field.
- Ensure your Central Feature tool parameters are configured as shown below and click Run.
As we might expect, the
2010
...
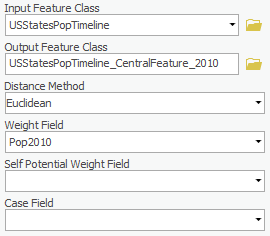
Result is Ohio.
2010
- For ‘Output Feature Class’, rename the layer ‘USStatesPopTimeline_CentralFeature_2010’ rename the feature class "USStatesPopTimeline_CentralFeature_2010".
- For ‘Weight Field,’ use the drop-down menu to select the Pop2010 field.
- Ensure your Central Feature tool parameters are configured as shown below and click Run.
...
The mean center is the average x and y coordinate of all the features in the study area. It's useful for tracking changes in the distribution or for comparing the distributions of different types of features.
1790
- In At the top of the Geoprocessing pane, click the the Back Arrow arrow button. In the search bar, search for ‘Mean Center’. Select Mean Center (Spatial Statistics Tools)
- Within the Measuring Geographic Distributions toolset, click the Mean Center tool.
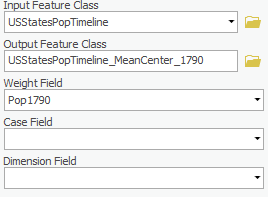
- For the ‘Input Feature Class’, use the drop-down menu , to select the USStatesPopTimeline layer.
- In ‘Output Feature Class,’ rename the layer ‘USStatesPopTimelinefeature class "USStatesPopTimeline_MeanCenter_1790’1790".
- In For ‘Weight Field,’ select Pop1790.Leave other fields as defaultuse the drop-down menu to select the Pop1870 field.
- Ensure your Mean Center tool parameters are configured as shown below and click Run.
...
You may hear of the standard deviation within a dataset, but if you want to measure the compactness of a distribution in a map, the following tool would come as handy.
1790
- In At the top of the Geoprocessing pane, click the the Back Arrow arrow button. In the search bar, search for ‘Standard Distance’. Select Standard Distance (Spatial Statistics Tools)
- Within the Measuring Geographic Distributions toolset, click the Standard Distance tool.
- For the ‘Input Feature Class’, use the drop-down menu , to select the USStatesPopTimeline layer.
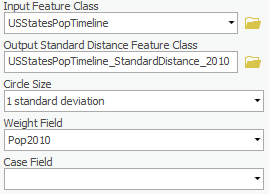
- In ‘Output Feature Class’, rename the layer ‘USStatesPopTimelinefeature class "USStatesPopTimeline_StandardDistance_1790’1790".
- In the For ‘Circle Size’, use the drop-down menu , leave it as to select 1 standard deviation.
- In For ‘Weight Field,’ use the drop-down menu to select Pop1790.Leave other fields as default the Pop1790 field.
- Ensure your Standard Distance tool parameters are configured as shown below and click Run.

...
- Rename the ‘Output Feature Class’ menu ‘USStatesPopTimeline"USStatesPopTimeline_StandardDistance_2010’2010".
- In ‘Weight Field,’ select Pop2010.
- Leave other fields as default.
- Ensure your Standard Distance tool parameters are configured as shown below and click Run.
...
Besides the compactness of the distribution, we can choose to find the directional trend, which calculate the standard distance separately in the x and y directions. These two measures define the axes of an ellipse encompassing the distribution of features, which is referred to as the standard deviational ellipse. The ellipse allows you to see if the distribution of features is elongated and hence has a particular orientation.
1790-1SD
- In At the top of the Geoprocessing pane, click the the Back Arrow arrow button.
- In the search bar, search for ‘Directional Distribution. Select Directional Distribution (Standard Deviational Ellipse) (Spatial Statistics Tools).
- For the ‘Input Feature Class’ drop-down menu, select USStatesPopTimeline.
- In ‘Output Feature Class’, rename the layer ‘USStatesPopTimeline_DirectionalDistribution1_1790’.
- For ‘Circle Size’, use the drop-down menu
- to select 1 standard deviation.
- In For ‘Weight Field,’ use the drop-down menu to select Pop1790.Leave other fields as default the Pop1790 field.
- Ensure your Directional Distribution tool parameters are configured as shown below and click Run.

...
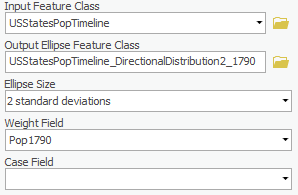
- In the ‘Ellipse Size’ drop-down menu, change to 2 standard deviations.
- In ‘Weight Field,’ make sure Pop1790 is selected.
- Ensure your Directional Distribution tool parameters are configured as shown below and click Run.
2010-1SD
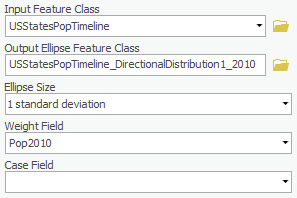
- Rename the ‘Output Feature Class’ ‘USStatesPopTimeline_DirectionalDistribution1_2010’.
- In ‘Ellipse Size’, select 1 standard deviation.
- In ‘Weight Field,’ select Pop2010.
- Ensure your Directional Distribution tool parameters are configured as shown below and click Run.
2010-2SD
- Rename the ‘Output Feature Class’ ‘USStatesPopTimeline_DirectionalDistribution2_2010’.
- In ‘Ellipse Size,’ change to 2 standard deviations.
- In ‘Weight Field,’ select Pop2010.
- Ensure your Directional Distribution tool parameters are configured as shown below and click Run.

You can see that the trend from the population distribution of 1790 to 2010.
...
The trend for a set of line features is measured by calculating the average angle of the lines. The statistic used to calculate the trend is known as the directional mean. The Linear Directional Mean tool lets you calculate the mean direction or the mean orientation for a set of line.
Roads
- Click the X on the top right corner of the Geoprocessing pane.
- In the Catalog pane, expand the Databases folder, and expand the GeographicDistributionData geodatabase. Drag the InnerLoopRoadsDissolved and the HoustonFreewaysDissolved feature classes into the Map Display.
- In the Contents pane, right-click on the InnerLoopRoadsDissolved layer and click Zoom to Layer.
- In the Analysis tab, click on the Tools button. In the Geoprocessing search bar, search for ‘Linear Directional Mean’. Select Linear Directional Mean (Spatial Statistics Tools).
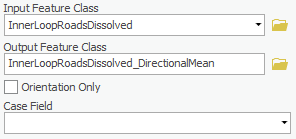
- For the ‘Input Feature Class’ drop-down menu, select InnerLoopRoadsDissolved.
- In ‘Output Feature Class’, rename it ‘innerLoopRoadsDissolved_DirectionalMean’.
- Leave other fields as default.
- Ensure your Linear Directional Mean pane appears tool parameters are configured as shown below . Select and click Run.
...
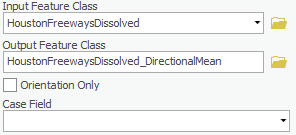
Freeways
- In the ‘Input Feature Class’ drop-down menu, select HoustonFreewaysDissolved.
- In ‘Output Feature Class’, rename it ‘HoustonFreewaysDissolved_DirectionalMean’.
- Leave other fields as default.
- Ensure your Linear Directional Mean pane appears tool parameters are configured as shown below . Select and click Run.