...
Notice that a new section called ‘Standalone Tables’ has appeared at the bottom of the Contents pane, because the tabular data you just added does not have a graphic spatial component, so it cannot yet be drawn and will not appear in the map view.
- In the Catalog pane, double-click the Rainfall.xls Excel file to expand it and view its individual worksheets.
- Under the Rainfall Excel file, drag the Sheet1$ worksheet into the Map Display right-click the Sheet1$ worksheet and select Add To Current Map.
Because both of the individual Excel worksheets were not renamed, they are both listed as Sheet1$ in the Table of Contents.
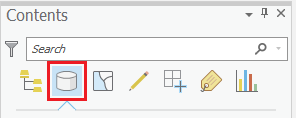
- At the top of the Contents pane, click the List By Data Source button.
- If you cannot see the entire file paths, hover Hover over the right edge of the Contents pane until your cursor turns into a double-sided arrow.
- Click and drag the right edge of the Contents pane to the right until you can see the full file paths, as shown below.
Now you can see the name of the Excel file from which each Sheet1$ originated, but to avoid further confusion, you will rename the Excel worksheet layers. This action will not rename the worksheets in the actual Excel file, but only how they are listed in the Contents pane in this particular projectMap.
- Underneath the Houses.xls file path, click the Sheet1$ table to select it.
- Click the directly on the Sheet1$ table name again to enable renaming and type “Houses”.
- Underneath the Rainfall.xls file path, click the Sheet1$ table to select it.
- Click directly on the Sheet1$ table name again to enable renaming and type “Rainfall”.
- Ensure your Pane appears as shown below.
Now you will examine what data is contained in each of the two tables.
...
- In the Contents pane, right-click the Rainfall table and select Display XY Data.
A Notice that the Geoprocessing pane will appear has opened on the right side of the windowas a new tab overlaying the Catalog pane. In the 'Make XY Event Layer' tool, notice that 'XY Table' is already set to the Rainfall table, since that was the table used to open the tool.
- For ‘X Field:’ use the drop-down menu to select the Longitude field.
- For ‘Y Field:’ use the drop-down menu to select the Latitude field.
- Ensure your window matches that below and click Run.

Your Map Display map now shows the location of each rain gauge as a point feature. The , but the functionality of your data will be limited until you export the data to a new layer. The locations of the points in the Rainfall table are currently stored in a temporary layer called Sheet1$_Layer. Since the points appear to be in reasonable locations, you will want to export the temporary layer into a new permanent feature class in within your default project geodatabase. Exporting to a feature class will allow you to manipulate these points and reuse them in other future map documents maps without having to go through the display XY data process each time.
- In the Contents pane, right-click the Sheet1$_Layer layer and select Data > Export Features.
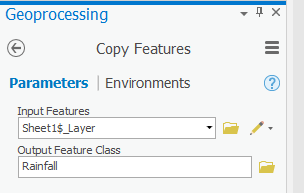
- For ‘Output Feature Class:’, scroll to the end and rename the feature class from “Sheet1_Features_CopyFeatures” to “Rainfall”.
- Ensure your ‘Copy Features’ window appears as shown below and click Run.
Since you have now created a permanent feature class, you may remove your temporary events layer and the corresponding Excel table.
- In the Contents pane, right-click the Sheet1$_Layer layer and select Remove.
- In the Contents pane, right-click the Rainfall table and select Remove.
Now you will repeat the same process to create a permanent point feature class for the Houses data table.
- Repeat steps 1 - 9 using the Houses table. Rename the exported feature class “Houses” and then remove the Houses table from the Table of Contents.
...