...
Now you will repeat the same process to create a permanent point feature class for the Houses data table.
Repeat
steps 1 - 9all steps in this Mapping XY Data section using the Houses table. Rename the exported feature class “Houses” and then remove the Houses table from the Table of Contents.
Your Map Display now shows the locations of all of the houses filing insurance claims due to the hurricane and you have all the necessary layers added into your map document.
...
- In the Geoprocessing pane, click the Toolboxes tab.
- Double-click the Spatial Analyst Tools toolbox > Interpolation toolset.
- Click the IDW (Inverse Distance Weighted) tool.
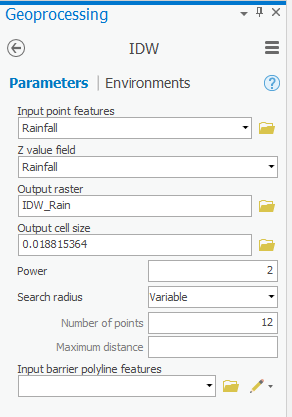
- In the ‘IDW’ window, use the ‘Input point features’ drop-down box to select the Rainfall layer, which contains your rain gauge data points.
- Use the ‘Z value field’ drop-down box to select the Rainfall field that contains the values you wish to interpolate.
- For ‘Output raster’, rename the exported raster from “Idw_Rainfall1” to “IDW_Rain”.
- Leave the other fields with their default settings, ensure your ‘IDW’ window appears as shown below, and click Run.
It will take several seconds for the tool to begin running, at which point you will see the name of the tool across the bottom portion of the Geoprocessing pane. When the tool has finished running, a box will pop up in the same corner with the name of the tool and a green checkmark.
...
- In the Contents pane, click the IDW_Rain layer.
- Click the Display tab.
- Under Under Feature Layer, on the Appearance tab, in the Effects group, adjust the Layer Transparency slider to 40%.
Notice that you can now see the other layers beneath the raster layer in the Map Display window.
The raster layer is currently symbolized using nine classes; however, the values of the cells in the raster are actually more continuous in nature, so you will symbolize them continuously, rather than in classes.
- Right-click the IDW_Rain layer and click select Symbology.
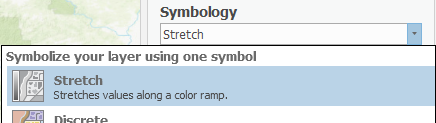
- At the top, beneath ‘Symbology,’ select Stretch.
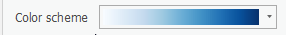
- Use the ‘Color scheme’ drop-down box to select a blue color ramp.
You can now see the continuously interpolated raster containing rainfall values that were generated using the data collected at the specific rain gauge points. Notice how this IDW method results in distinct rings around each input data point.
- In the Contents pane, uncheck the IDW_Rain layer.
- In the Geoprocessing pane, click the Toolboxes tab.
- In the Interpolation toolset, double-click the Spline tool.
- Repeat steps 5-16 above in the Inverse Distance Weighted Interpolation Method section on pages 12 and 13, but rename the raster output “Spline_Rain”.
...