...
- At the top of the Geoprocessing pane, click the Back arrow button.
- Within the Spatial Statistics toolbox, click the Mapping Clusters toolset > Hot Spot Analysis (Getis-Ord GI*) tool.
- In the upper right corner of the ‘Hot Spot Analysis’ tool, hover over the Help ? button.

- For 'Input Features', use the drop-down menu to select the CensusTracts_Race_2014 layer.
- For 'Input Field', use the drop-down menu to select the Percent_White field.
- For 'Output Feature Class', rename the feature class "HSA_White".
- For 'Distance Band or Threshold Distance', type "24962".
- Click Run.
Unlike the previous tools, which only
| Info |
|---|
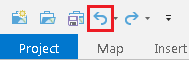
If your newly added HSA_White layer changes from the default blue, white, and red symbology to a single color symbology, hover over the Undo button on the Quick Access toolbar, above the ribbon.
If the undo step says "Symbology - update layer renderer : HSA_White, the click the Undo button to restore the default symbology. |
- Above the ribbon, on the Quick Access toolbar, click the Save button.
Cluster and Outlier Analysis (Anselin Local Moran's I)
...