...
- Right-click the Shapefile and selectAttribute Table. Take note of the field which contains the unique identifier on which your join will be based. In this case the field is GEOID10. Hover over the GEOID10column header and notice that the Type of the field is Text.
- In the Contents pane, right-clickSocialExplorerDownload and select select Open. Notice the name of the field that matches the shapefile’s field. In this table, it is named FIPS. Hover over the FIPS title and notice that the Type of the field is Double. This is not compatible with the Text field of the shapefile.
- In the Contents pane, right-click the SocialExplorerDownload table and selectDesign > Fields.
- Scroll to the bottom of the fields list and click on the ‘Click here to add a new field.’
- For the Field Name, type in FIPS_Text. Change the Data Type to Text. In the Data tab, click the Save button.
- In the Contents pane, right-click the SocialExplorerDownload table and select Open. Scroll all the way to the right. Right-click on the FIPS_Text header and select select Calculate Field.
- In the Geoprocessing pane, under the Fields menu, double-clickFIPS. Notice that the smart code reads ‘FIPS_Text = !FIPS!’. When your window looks like the window below, select Run.

Join
...
- In the Contents pane, right-click on the Shapefile. Under Joins and Relates, select select Add Join.

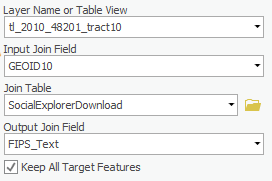
- In the Geoprocessing pane, notice the “Input Join Field” drop-down menu. Select GEOID10. ArcGIS Pro has automatically selected the SocialExplorerDownload for the “Join Table”. Under “Output Join Field”, select FIPS_Text. Ensure your window looks like the window below and select Run.
- In the Contents pane, right-click the Shapefile and selectAttribute Table. Scroll to the right and notice the census data has been appended to the fields.
- In the Contents pane, right-click the Shapefile and selectData > Export Features. In the Geoprocessing pane, rename the Output Feature Class CensusTractData. When your window looks like the window below, select Run, select Run.

Symbolize
Explore the patterns in your data or create a layout to share.
- In the Contents pane, right-click CensusTractData and select Symbology. The Symbology pane will open to the right of the Map Window.
By default, all features are symbolized on a Single Symbol. Since this data represents continuous numeric values, it should be represented as Quantities.
- Under the Symbology drop-down menu, select Graduated Colors.
- In the Field drop-down menu, select ‘Hispanic’.
- In the Normalization drop-down menu, select ALAND10.
This setting normalizes the population of Hispanic people by land area to adjust for large and small census tracts.

- Change the Normalization selection to TotalPop. The data now shows the Hispanic population as a percentage of the total population, accounting for heavily populated tracts.