...
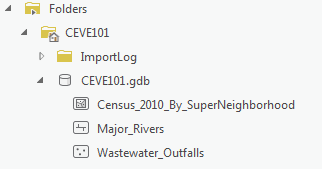
- In the Catalog pane on the right, expand Folders > CEVE101 > CEVE101.gdb. There are currently no data in this folder.
- Right-click Folders and select Add Folder Connection.
- In the left column click Computer. in the right column double click C: > Users > gistrain. Single click Downloads and select OK.
- In the Catalog pane, expand Downloads.
- Fully expand all folders and geodatabases in the Downloads folder.
- Drag and drop the Major_Rivers feature class into the CEVE101.gdb
- Repeat drag and drop for Wastewater_Outfalls
- Right-click the CEVE101.gdb and select Import > Feature Class

- Click the Browse button to navigate to input features. In the left column click Folders. In the right column click Downloads > Census_2010_By_SuperNeighborhood. Single click Census_2010_By_SuperNeighborhood.shp
- Type "Census_2010_By_SuperNeighborhood" into the Output Feature Class bar.
- Click Run.
- In the Catalog pane, expand the CEVE101.gdb. There are now three feature classes contained within: Major_Rivers, Census_2010_By_SuperNeighborhood, Wastewater_Outfalls

- Right-click on the Downloads folder. Select Remove.
...
- In the Catalog pane on the right, right-click the Census_2010_By_SuperNeighborhood feature class and select Add To Current Map.
- An alternative method of adding data to a map is to click and hold the Major_Rivers feature class and drag and drop it into the Wastewater Houston Outfalls map view.
- Repeat either method to add Wastewater_Outfalls to the map view.
...
- In the Contents pane on the left, click the colored rectangle symbol beneath the Census_2010_By_SuperNeighborhood layer name.

- On the right in the Symbology pane, for 'Color', use the drop-down menu to select Mango.
- For 'Outline color', use the drop-down menu to select Gray 50%.
- At the bottom of the Symbology pane, click Apply.
- In the Contents pane on the right, right-click the colored point symbol beneath Wastewater_Outfalls layer name. Select Mars Red.

The super neighborhood polygons are now easy to distinguish from both the basemap and the rivers, while the wastewater outfalls are highly visible in red.

Navigating the Project
Navigating the Contents Pane
...
- Use the 'Normalization' drop-down menu to scroll to the bottom and select the last Shape_Area field.
As discussed in the Introduction to GIS Data Management course, the The projection of the census layer is WGS 1984. Therefore, the layer is unprojected and the coordinates are stored in angular units of decimal degrees. Therefore, the Shape_area field is displaying square decimal degrees and the map is displaying number of vacant housing units per square decimal degree. This is a somewhat incomprehesible unit, however, the values are still proportional to how they would be in a different unit and the relative coloring on the map remains correct. If you wanted to make a map that displays Notice that according to the density of vacant housing units per square mile, then you would add a new field to the attribute table and use the calculate
projecting is further covered in the Introduction to Coordinate Systems and Projections course.
Notice that according to the density of vacant housing units, the greatest amount of vacant housing units appear to be both inside and outside the loop along , the greatest amount of vacant housing units appear to be both inside and outside the loop along 59.
- Use the 'Normalization' drop-down menu to select the SUM_HU100 field.
The map is now displaying the number of vacant housing units divided by the total number of housing units, or the percent vacant housing units. While all three these methods of symbolizing the vacant housing units are techically corect technically correct This is probably the most common display method.
...
- In the ribbon, click the Map tab.
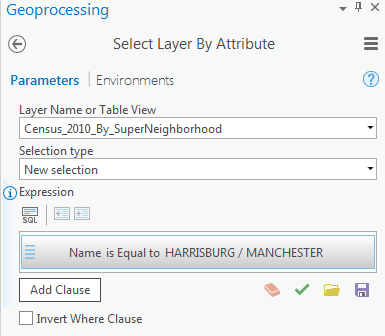
- In the Selection group, click the Select By Attributes button to open the Select Layer By Attribute tool in the Geoprocessing pane.
- In the Geoprocessing pane, click the Add Clause button.
- Use the drop-down menus to build the following expression: Name is Equal to 'HARRISBURG/MANCHESTER' and click the Add button.
- Ensure your Geoprocessing pane appears similar to that below and click Run.

Exporting Selected Features
...
- On the ribbon, click the Insert tab.
- In the Project group, click the New Map button.
- At the bottom of the Geoprocessing pane, click the Catalog pane tab.
- Rename your map to "Neighborhood Outfalls" and addHarrisburg_Manchester, Wastewater_Outfalls and Major_Rivers.
- In the Selection group, click the Select By Location button to open the Select Layer By Location tool in the Geoprocessing pane.
- Select Wastewater_Outfalls within Harrisburg_Manchester. Ensure your Geoprocessing pane appears similar to that below and click Run.
 Select Major_Rivers that intersect Harrisburg_Manchester.
- In the Contents pane, right-click the the Wastewater_Outfalls layer layer name and and select Data > Data > Export Features.
- In the Geoprocessing pane, click the the 'Output Feature Class' field to edit the name. Replace Wastewater Wastewater_Outfalls with with "HM_Outfalls". Ensure that you leave everything in the file path through CEVE101.gdb\.
- On the the Map tab, in the Selection group, click the Clear button to clear the selected features.
- Select Major_Rivers that intersect Harrisburg_Manchester.
- In the Contents pane, right-click the Major_Rivers layer name and select Data > Export Features.
- In the Geoprocessing pane, click the 'Output Feature Class' field to edit the name. Replace Major_Rivers with "HM_Rivers". Ensure that you leave everything in the file path through CEVE101.gdb\..
- On the the Map tab, in the Selection group, click the Clear button to clear the selected features.
- In the Contents pane, rightRight-click on Wastewater_Outfalls and select select Remove. Repeat removal for Major_Rivers.
You now have a map of the Harrisburg/Manchester Super Neighborhood with the rivers that intersect it and the wastewater outfalls that lie within it.
...