...
- In the Contents pane, right-click the CensusCOH_2010HISTORIC_By_SuperNeighborhoodSITESLANDMARKS layer name and select Zoom To Layer.
...
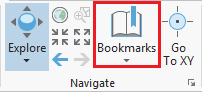
- On the Map tab, in the the Navigate group, click the Bookmarks button and select New Bookmark....
- In the 'Create Bookmark' window, for 'Name:', type "Houston Historic Districts" and click OK.
- To test the bookmark, use panning and zooming to change the extent of the map.
- Again, click the Bookmarks button and this time select the Houston Historic Districts bookmark to return to that extent.
...
- On the Map tab, in the Selection group, click the Select button.
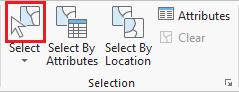
- In the map view, click on any neighborhoodhistoric district to select it.
The selected neighborhood historic district will be outlined in cyan.
- Drag a box to select multiple adjacent neighborhoodshistoric districts.
- Hold down Shift and click any non-selected neighborhood to historic district to add additional non-adjacent neighborhoods historic districts to the selection.
- Hold down Ctrl and click any selected neighborhood to historic district to deselect neighborhoods.
When you are finished using a selection, it is important to clear the selected features, because the majority of tools in ArcGIS Pro only run on selected features. Therefore, if you run a tool anticipating that you will be processing all features in a particular layer and you inadvertently left some features selected from a previous process, only those selected features will be processed, which will lead to unexpected results.
...
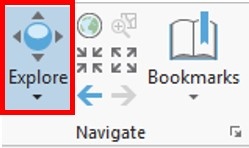
- On the Map tab, in the Navigate group, click the Explore button.
Selecting Features Manually from the Table View
- In the Contents pane, right-click the CensusCOH_2010HISTORIC_By_SuperNeighborhoodDISTRICTS layer name and select Attribute Table.

A table view now appears docked beneath your map view. Each row, or record, in your table corresponds to exactly one super neighborhood historic district polygon on the map. Each column, or field, in your table represents a variable describing the super neighborhoodshistoric districts.
Every geodatabase feature class has two to four default fields, which cannot be edited or deleted. The leftmost OBJECTID field is a unique ID that is automatically numbered from 1 to the total number of features at the time of creation. In this particular case, the field is called OBJECTID_1, because there was a preexisting OBJECTID field at the time this data was imported to geodatabase format by the City of Houston. The Shape field indicates whether the feature geometry contains points, lines, or polygons.
- In the table view, use the scroll bar at the bottom to scroll to the far right of the table.
The other two default fields are the last Shape_Length The other two default fields are the last Shape_Length and Shape_Area fields which contain the perimeter and area of the super neighborhoodshistoric districts, respectively. A line feature class will only contain the Shape_Length field and a point feature class will not contain either field. The units of these fields correspond to the units of the projection in which the data coordinates are stored.
- In the Contents pane on the left, double-click the CensusCOH_2010_By_SuperNeighborhood layer HISTORIC_DISTRICTS layer name.
- In the 'Layer Properties' window, in the left column, click the third tab, Source tab.
- At the bottom of the window, click to expand the Spatial Reference section.
- Use the scroll bar on the right to scroll to the bottom of the metadata.
Within the Spatial Reference section, notice that the geographic coordinate system is WGS 1984 and that no projected coordinate system is listed. Therefore, the layer is unprojected, meaning the data coordinates are located on the three-dimensional surface of the globe and you can see the Angular Unit is listed as Degrees (or decimal degrees.) Therefore, the Shape_Length field is displaying decimal degrees and the Shape_Area field is displaying square decimal degrees, which is why the numbers are so low. Before measuring distance or area, the data layer should be projected onto a two-dimensional surface. The resulting projection will have a Linear Unit, such as feet or meters. The process of projecting is further covered in the Introduction to Coordinate Systems and Projections course.
As indicated by the layer name, the majority of the remaining fields contain 2010 census data that was aggregated to the super neighborhood level by the City of Houston, since that is not a geographic unit at which the Census Bureau provides data.
- Close the 'Layer Properties' window.
- In the Attribute Table, Double-click the 'Name' field header to sort the neighborhoods alphabetically.
- To select a neighborhood from the table, click the gray square to the far left of each row.
- To select an adjacent section of records, hold down Shift and select a record below or above the currently selected record to automatically select all records in between.
- To add or remove individual records from the selection, hold down Ctrl and select another record.
...