...
- In the Contents pane, right-click the Watersheds layer and selectSymbology.
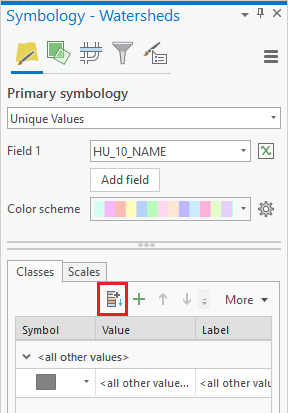
- In the Symbology pane, use the 'Primary symbology' drop-down menu to selectUnique Values.
- Use the ‘Field 1’ drop-down menu to select the HU_10_NAME field.
- Use the ‘Color Scheme’ drop-down menu to select the color ramp of your choice.

- On the bottom half of the Symbology pane, if only one category called <all other values. shows upvalues> is listed, as shown below, click the Add all values button.
Notice that the subwatersheds from the previous layer have now been grouped into 8 watersheds within the Buffalo-San Jacinto subbasin. Notice also that the transparency originally applied to the Subwatershed layer, was maintained as the layer was re-exported and then merged, such that the Topographic basemap still appears through it.
- Ensure
- As before, apply 60% transparency to the Watersheds layer.
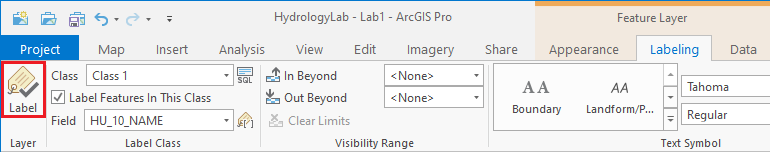
- Make sure that the Watersheds layer is selected in Contents and click Labeling under pane.
- On the ribbon, click the Feature Layer contextual Labeling tab on the main tab display.
- Select HU_10_Name in the Field drop-down menu. Click the Label icon to turn on the labels.

Depending on your screen size, you may notice the easternmost watershed does not get labeled if there is not adequate space for the required text. This could be adjusted using advanced labeling techniques, but you will leave the map as is.
- In the Label Class group, for 'Field', ensure the HU_10_NAME field is selected.
- In the Layer group, click the Enable Labeling button to turn on the labels.
Creating a layout
- On the ribbon, click the Insert > New Layout > ANSI Landscape > Letter.
- Click Insert tab and click Map Frame.
- tab.
- In the Project group, click the New Layout button and, under the 'ANSI - Landscape' section, click Letter 8.5" x 11".
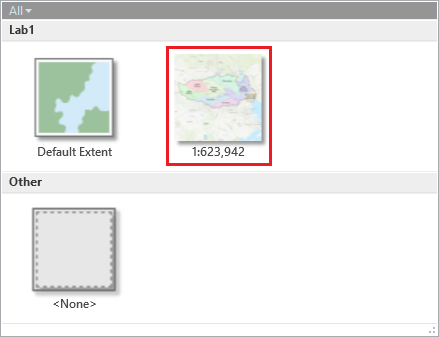
- On the ribbon, click the Map Frame group and, under the 'Lab1' map section, click the map frame with the scale listed, such as 1:600,000.
 Select the Lab1 map under Map.
- Select Layout tab and click Activate.
- Right-click the Watersheds layer and click Zoom to Layer.
- Select Layout tab and click Close Activation.

...