...
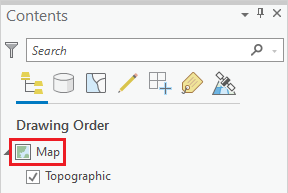
- In the Contents pane, click Map once to select it. Then, click directly on the Map text a second time and rename it "Lab1Lab1Hydrology".
Part 2: Mapping Watershed Data
...
- In the Catalog pane on the right of the map view, expand Folders, right-click your HydrologyLab folder, and select Refresh.
- Expand the HydrologyLab folder > NFIEGeo_12.gdb geodatabase > Geographic feature dataset to preview what feature classes, or layers, it contains.
Drag the Geographic feature dataset from the Catalog pane into the Lab1Lab1Hydrology map view.
If you ever close the Catalog pane, you can reopen it by clicking the View tab on the ribbon and then clicking the Catalog Pane button.
...
- On the ribbon, click the Insert tab.
- In the Project group, click the New Layout button and, under the 'ANSI - Landscape' section, click Letter 8.5" x 11".
- On the ribbon, click the Map Frame group and, under the 'Lab1Lab1Hydrology' map section, select the second frame that is labeled with the scale, such as 1:600,000.
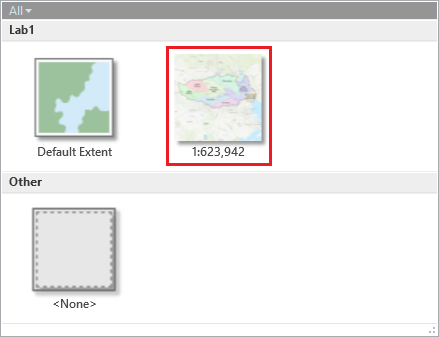
- Under the 'Rice Bus Routes' map section, select the second frame that is labeled with a scale, such as 1:600:000.
- Click and hold near the top left corner of the layout page and drag the rectangle near the bottom right corner or the layout page.
- In the Contents pane, right-click the Watersheds layer and select Zoom to Layer.
...
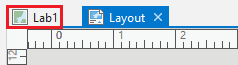
- At the top left of your Layout view, click the Lab1 Lab1Hydrology map tab to return to your map view.
- In the Contents pane, check the Flowline and Catchment layers to make them visible.
...
Symbolizing features by quantities using graduated symbols
- Return to the Lab1 Lab1Hydrology map view.
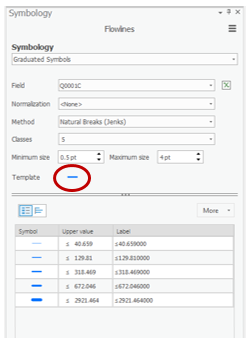
- Open the Flowlines Symbology tab.
- Use 'Primary Symbol' drop down menu to select Graduated symbols.
- Use the ‘Field’ drop-down menu to select the Q0001C field, which contains the mean annual flow.
- Click the line next to Template to change the symbology of your flowlines.
- Save your project.
...
- Return to the Layout view.
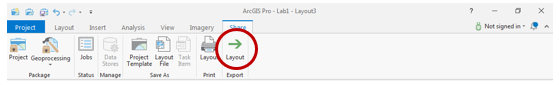
- On the ribbon, click the Share tab and click the Layout button in the Export group to open the Export Layout pane on the right.
- In the Export Layout pane, use the 'File Type' drop-down menu to select PDF.
- For 'Name', type "Lab 1 WatershedsHydrology" and click Export.
- Save your project.
...
You will now clip the soil polygons to the extent of the Buffalo-San Jacinto subbasin.
- On the ribbon, click the Analysis tab and click the Tools button.
- At the top of the Geoprocessing pane, in the 'Find Tools' search bar, type "clip" and press Enter.
- Click Clip (Analysis Tools).
Read the ‘Clip’ window help and review the sample illustration. Notice that this tool clips one dataset to the extent, or shape, of another dataset.
- For ‘Input Features’, use the drop-down menu to select the Map UnitsMapunits layer.
- For ‘Clip Features’, use the drop-down menu to select the Subbasin layer.
Hover over the ‘Output Feature Class’ field and note that the file path did not default to your HydrologyLab geodatabase, but instead to the default geodatabase that was referenced in the map package you downloaded. You will change this to your default project geodatabase.
- For 'Rename Output Feature Class', click the Browse button.
- Navigate to your HydrologyLab folder and double-click the HydrologyLab geodatabase.
- For 'Name', type “Soils” and click RunSave.
- In the Geoprocessing pane, again hover over the ‘Output Feature Class’ field to ensure the output Soils feature class will be stored in your HydrologyLab geodatabase and click Run.
Notice that the resulting Soils layer maintains the soil class boundaries, but limits the extent Notice that the resulting Soils layer maintains the soil class boundaries, but limits the extent of the soils layer to the extent of the subbasin boundary. You no longer need the master Map Units layer and may remove it.will now return to your main HydrologyLab project window.
- Close the BuffaloSanJacinto_12040104 project in ArcGIS Pro without saving.
- Return to your HydrologyLab project.
- On the ribbon, click the Insert tab.
- On the far left, click the New Map button.
- At the bottom of the far right pane, click the Catalog tab.
- Right-click the HydrologyLab.gdb geodatabase and select RefreshIn the Contents pane, right-click the Map Units layer and select Remove.
- Open the Soils Symbology pane.
- Click Graduated colors.
- Use the ‘Field’ drop-down menu to select the Available Water Storage 0-100 cm – Weighted Average field.
...