...
Notice that the resulting Soils layer maintains the soil class boundaries, but limits the extent of the soils layer to the extent of the subbasin boundary.
You will now return to your main HydrologyLab project application window.
- Close the BuffaloSanJacinto_12040104 project in ArcGIS Pro without saving.
- Return to your HydrologyLab project.
- On the ribbon, click the Insert tab.
- On the far left, click the New Map button.
- In the Contents pane, click Map once to select it. Then, click directly on the Map text a second time and rename it "Lab1Soils".
- At the bottom of the far right pane, click the Catalog tab.
- Right-click the HydrologyLab.gdb geodatabase and select Refresh.
- Open the Soils Symbology pane.
- Click Graduated colors.
- Drag the newly clipped Soils feature class from the Catalog pane to the Lab1Soils map view.
- Also, drag the Subbasin feature class from the Catalog pane to the Lab1Soils map view.
- Symbolize the Subbasin layer using the same symbology as you used in the Lab1Hydrology map, with no color and a black outline.
Symbolizing features by quantities using graduated colors
- In the Contents pane, click the Soils layer to select it.
- If necessary, open the Symbology pane.
- For 'Primary symbology', select Graduated Colors.
- For ‘Field’, Use the ‘Field’ drop-down menu to select the Available Water Storage 0-100 cm – Weighted Average field.
...
- Experiment with the 'Method', 'Classes', and 'Color scheme' fields.
Notice that the density of the polygon outlines obscures the colors of the polygons themselves.
- Shift select all symbols. Right-click to select Format Symbols….
There is a bug in the software that sometimes prevents the ‘Properties for All Symbols’ interface from opening. As an alternative, you may shift-select all five symbols and right-click and select Properties for Selected Symbol(s)….
- On the bottom half of the symbology pane, click the More drop-down button and select Formal all symbols.
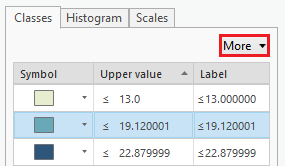
- Use the ‘Outline Color’ Click Properties. Use the ‘Outline Color:’ drop-down menu to select No Color.
- Click Apply.
- Symbolize the Subbasin layer using the same symbology as you used in the Lab1 map document.
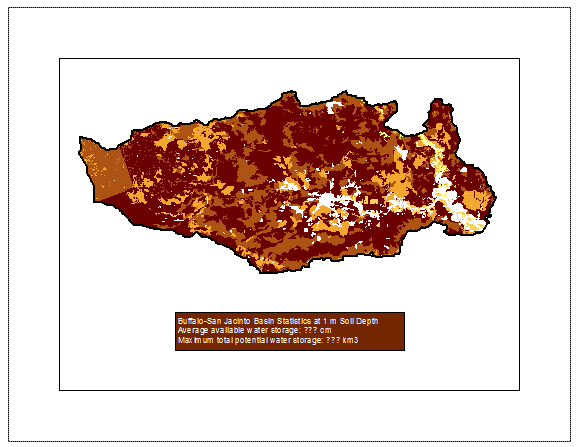
Now you will calculate the water storage capacity of the top 1 m of soil within the Buffalo-San Jacinto subbasin.
- Open the Soils layer attribute table.
- Calculate statistics for the Available Water Storage 0-100 cm – Weighted Average field.
Based on the statistics you have just seen, calculate the answers to the questions listed for the map layout to be turned in on the following pagebelow. Note that, technically, a true calculation of the average available water storage for the subbasin would require factoring in the area of each soil polygon to calculate a weighted average. In this case, just use the statistical mean as it is listed in the ‘Statistics’ window. Similarly, the total water storage for the subbasin would require multiplying the available water storage by the area of each soil polygon and then summing the results. In this case, you may simply multiply the area of the entire subbasin by the statistical mean as it is listed in the ‘Statistics’ window.
As before, create a new map layout and add the statistics using a rectangle text elementthe statistics using a rectangle text element. When your layout is complete, export it as a PDF.
TO BE TURNED IN: An 8.5 x 11 map document showing the soils clipped to the Buffalo-San Jacinto subbasin and a text box containing the answers to the following questions:
- What is the average available water storage (cm) in the Buffalo-San Jacinto subbasin?
- Based on your previous calculation of the area of the subbasin in km2, what volume of water (km3) could potentially be stored in the top 1 m of soil in the Buffalo-San Jacinto subbasin if the soil were fully saturated with water?
Exporting map documents
- To export both your Lab1Hydrology and Lab1Soils map documents, open each of them in turn and click the Share menu and select Export Layout….
- Navigate to your HydrologyLab folder.
- Use the ‘Save as type:’ drop-down menu to select PDF.
- Click Export.
- Print both map PDFs to turn in.
Deliverables
- Create an 8.5 x 11 layout with the following layers limited to the subbasin:
...