...
- Select Columns A though AB in the SocialExplorerDownload.csv table by clicking on the gray area in the top-left hand corner of the table. Double-click on the line between any two columns to resize the column widths. All cell contents should be visible.
- Delete unneeded columns:
- The identifying fields repeat information that we don’t need. Delete Area Name-Legal/Statistical Area Description, Qualifying Name, Summary Level, Geographic Component, State (FIPS), County, County Size Code, County Subdivision, and Census Tract. Be sure to keep FIPS.
- Delete the copy of Total Population.
- Delete all columns after Total Population: Hispanic or Latino.
- Rename the field names with the following criteria: Remove all spaces and special characters, must begin with a letter, fewer than 64 characters. Keeps Keep FIPS as it is. TotalPop. NonHispanic. White.etc
- Delete Row 2 with “SE_T055_001”

- Click File > Save As. Select the BringingCensusData folder.
- Under ‘Save as type:’ select the top option, ‘Excel Workbook (*.xlsx)’. Click Save.
...
We will obtain our geography from the Census Bureau.
- Open a web browser. Search for “TIGER/Line.”
- Select the first option for Census.gov.
- Navigate to the 2010 TIGER/Line Shapefiles.
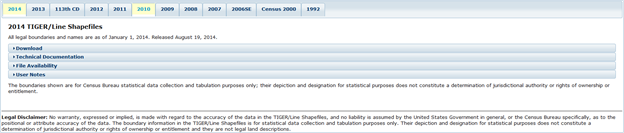
- Click on the Download tray to expand it.
- Under Download by File Type, select Web Interface.
- For ‘Select year’, choose 2010.
- For ‘Select a layer type’, choose Census Tracts. Click Submit.
- Under Census Tract (2010) ‘Select a State’, select Texas.
- Under ‘Select a County’, select Harris County. Click Download. tl_2010_48201_tract10.zip will begin to download.
...
Notice the TIGER/Line shapefile is one item, while viewing it on the Windows menu it had been six. ArcGIS automatically reads shapefiles as one document.
- Click the TIGER/Line shapefile you downloaded, ‘tl_2010_48201_tract10.shp’, and drag it into the Map Window.
...
- In the Analysis tab, select the Tools button. In the Find Tools search bar in the Geoprocessing pane, type ‘Excel to Table.’ Select Excel To Table (Conversion Tools).
- For the ‘Input Excel File’, click the Browse button and navigate to your BringingCensusData folder. Single-click on the SocialExplorerDownload.xlsx and click Open.
- For the ‘Output Table’, rename it ‘SocialExplorerDownload.’ Make sure your window looks like the window below and select Run.

Format Tables
Append data from your table to your geography.
- Right-click the Shapefile and select Attribute Table. Take note of the field which contains the unique identifier on which your join will be based. In this case the field is GEOID10. Hover over the GEOID10column header and notice that the Type of the field is Text.
- In the Contents pane, right-click SocialExplorerDownload and select Open. Notice the name of the field that matches the shapefile’s field. In this table, it is named FIPS. Hover over the FIPS title and notice that the Type of the field is Double. This is not compatible with the Text field of the shapefile.
- In the Contents pane, right-click the SocialExplorerDownload table and select Design > Fields.
- Scroll to the bottom of the fields list and click on the ‘Click here to add a new field.’
- For the Field Name, type in FIPS_Text. Change the Data Type to Text. In the Data tab, click the Save button.
- In the Contents pane, right-click the SocialExplorerDownload table and select Open. Scroll all the way to the right. Right-click on the FIPS_Text header and select Calculate Field.
- In the Geoprocessing pane, under the Fields menu, double-click FIPS. Notice that the smart code reads ‘FIPS_Text = !FIPS!’. When your window looks like the window below, select Run.

Join
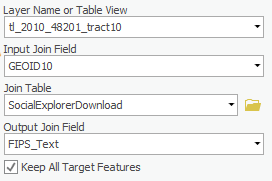
- In the Contents pane, right-click on the Shapefile. Under Joins and Relates, select Add Join.

- In the Geoprocessing pane, notice the “Input Join Field” drop-down menu. Select GEOID10. ArcGIS Pro has automatically selected the SocialExplorerDownload for the “Join Table”. Under “Output Join Field”, select FIPS_Text. Ensure your window looks like the window below and select Run.
- In the Contents pane, right-click the Shapefile and select Attribute Table. Scroll to the right and notice the census data has been appended to the fields.
- In the Contents pane, right-click the Shapefile and select Data > Export Features. In the Geoprocessing pane, rename the Output Feature Class CensusTractData. When your window looks like the window below, select Run.

...
This setting normalizes the population of Hispanic people by land area to adjust for large and small census tracts.

- Change the Normalization selection to TotalPop. The data now shows the Hispanic population as a percentage of the total population, accounting for heavily populated tracts.
...