...
This course will teach you how to download, evaluate, and prepare GIS data from public online sources and set up a project in ArcGIS Pro.
...
Obtaining Tutorial Data
The best option for getting the full GIS project experience is to download data from online GIS data portals. You will also gain exposure to the best GIS data websites for the Houston region. For this exercise, we will be looking at rivers and wastewater outfalls in Houston's Super Neighborhoods.
Downloading
...
Source Data from GDC
Super Neighborhood Dataset
Click the following link to obtain the Super Neighborhood dataset: SuperNeighborhoods2010Census.zip
Downloading Data from Source Websites
H-GAC GIS Dataset
The Houston-Galveston Area Council (H-GAC) is the 13-county Metropolitan Planning Organization (MPO) for the Houston region. Federal legislation requires that an MPO be designated for each urbanized area with a population greater than 50,000 people (as established by the U.S. Census Bureau) in order to conduct long-range metropolitan transportation planning and be eligible for Federal funding for transportation projects. Their mission to carry out metropolitan transportation planning means that MPOs are a great source of data on topics such as demographics, employment, land use, transportation, and environmental conditions and most of these topics are well-suited towards GIS analysis.
Most of the data provided on the H-GAC portal is not originally created by the H-GAC, but rather is either aggregated from multiple municipalities up to the 13-country region, or clipped from the country or state down to the 13-county region
...
COHGIS Open Data Portal
The COHGIS (City of Houston GIS) Open Data Portal website provides over 100 data sets including administrative boundaries, amenity locations, transportation routes, crime, and flooding. For this tutorial, we will download population and housing data from the 2010 census, which has been aggregated to super neighborhood boundaries.
- Using a web browser, search for for "houston h-gac gis data" and select the result as shown below or or go directly to: https://cohgisgishub-h-mycitygac.opendatahub.arcgis.com/.

Whenever you see a URL that ends in opendata.arcgis.com, you will know that you are visiting a standard ArcGIS Open Data portal.
...
In this case, we are looking for census data by super neighborhood. To learn more about super neighborhoods, visit the City of Houston Super Neighbhorhoods webpage.
...
H-GAC GIS Datasets
The Houston-Galveston Area Council (H-GAC) is the 13-county Metropolitan Planning Organization (MPO) for the Houston region. Federal legislation requires that an MPO be designated for each urbanized area with a population greater than 50,000 people (as established by the U.S. Census Bureau) in order to conduct long-range metropolitan transportation planning and be eligible for Federal funding for transportation projects. Their mission to carry out metropolitan transportation planning means that MPOs are a great source of data on topics such as demographics, employment, land use, transportation, and environmental conditions and most of these topics are well-suited towards GIS analysis.
Most of the data provided on the H-GAC portal is not originally created by the H-GAC, but rather is either aggregated from multiple municipalities up to the 13-country region, or clipped from the country or state down to the 13-county region.
...

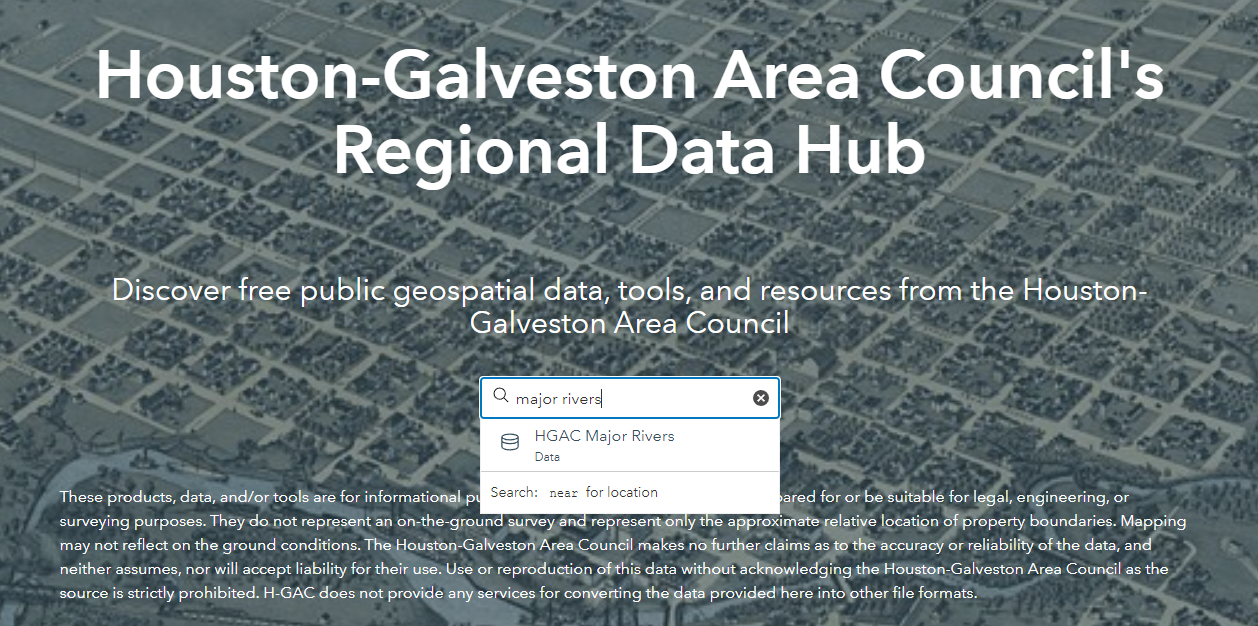
- In the "Search data" box, type in "Major Rivers" without pressing "Enter".
- The option "HGAC Major Rivers" should pop up - click on this option.
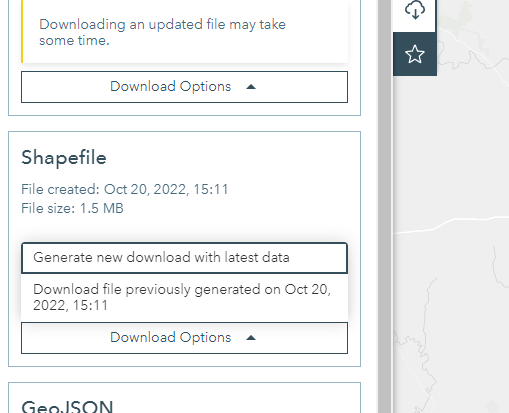
- Now, we can see the rivers depicted on a map in the Houston-Galveston area. We want to access this data in the form of a shapefile. To do this, click the "Download" button on the left side of the screen, as shown below.

- Scroll down on the left pane to the "Shapefile" tab. Click "Download Options" followed by "Download file previously generated on ...". A zip file titled "HGAC_Major_Rivers.zip" should be downloaded.
H-GAC GIS Dataset
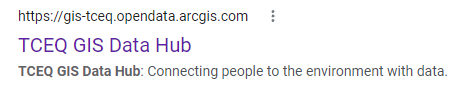
- Using a web browser, search for "tceq gis data hub", and click on the link shown below. Alternatively, go directly to their website here: https://gis-tceq.opendata.arcgis.com/
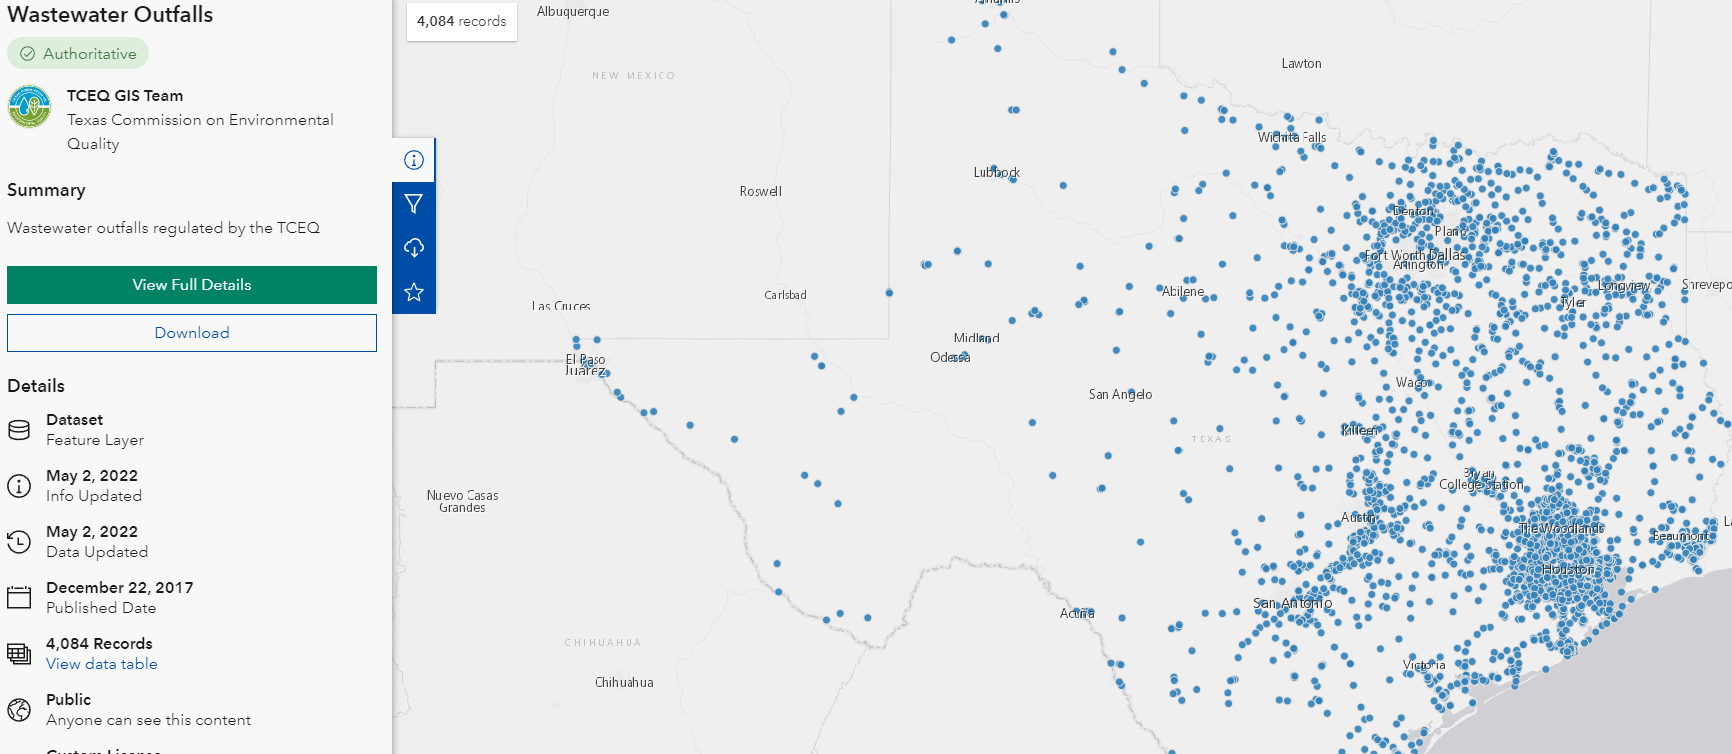
- In the "Search data" box, type in "Wastewater" without pressing "Enter".

- The option "Wastewater Outfalls" should pop up - click on this option.

- Now, we can see the wastewater outfalls in Texas depicted on a map. We want to access this data in the form of a shapefile. To do this, we follow the same download procedures as with the "Major Rivers" dataset, which should result in a zip file titled "Wastewater_Outfalls.zip".
...
HCAD
Though it is not used in this course, the Harris County Appraisal District (HCAD) Public Data is another great online source that provides similar data such as highways, utilities, and water districts and is available at: http://pdata.hcad.org/GIS/index.html
Preparing the Downloaded Data for ArcGIS Pro
Once you have downloaded the Super Neighborhoods from COHGIS and the Wastewater Outfalls and Major Rivers from H-GAC, you will be able to find the data files in your Downloads folder. All of the files are zipped, meaning they contain compressed files of data within them (you can tell a file is zipped when the file type column reads “Compressed (zipped) Folder”). You will need to unzip the folders to be able to see the data inside them. To do that:
- On the Desktop, click the File Explorer icon located on the Windows Taskbar on the bottom left corner of the screen.
- In the left column, click My Computer. In the right column, double-click C:/ > Users > gis.ADRICE > Downloads.
- Using File Explorer, open the Downloads folder.
- Ensure that you see the following zipped folders in your Downloads folder.
...
- SuperNeighborhoods2010Census
- HGAC_Major_Rivers
- Wastewater_Outfalls
- Select all three folders.
- Right-click any of the selected folders and select 7-Zip > Extract hereHere. Your data is in a file folder in its decompressed format and ready to be brought into ArcGIS Pro.
...
Creating a New Project in ArcGIS Pro
- From the Start menu, launch ArcGIS Pro.
- When ArcGIS Pro opens, under the Create a new project section, click the Blank project template.
- In the 'Create a New Project' window, for Name, type "CEVE101".
- For Location, click the Browse... button to the right.
- In the 'Select a folder to store the project.' window, click Computer in the left column and click Desktop in the right column and click the desired location for GIS projects on your computer and click OK.

- ClickOK once again.
- Maximize the ArcGIS Pro application window.
Creating a New Map
A map is a project item used to display and work with geographic data in two dimensions. The first step to visualizing any data is creating a new mapany data is creating a new map.
The ribbon runs horizontally across the top of the ArcGIS Pro interface. Tools (buttons) are organized into tabs along the ribbon.
- On the ribbon, click the Insert tab.
- In the Project group, click the New Map button.
...
- In the Catalog pane, under the Maps section, right-click Map and select Rename.
- Type "Houston Outfalls" and hit Enter.
Saving a Project
Any time you create a new project item, such as a map or a layout, or any time you spend time adjusting the symbology of your map layers, it is a good idea to save your project.
- Above the ribbon, on the Quick Access toolbar, click the Save button.
Managing GIS Data
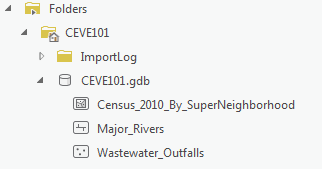
- In the Catalog pane on the right, expand Folders > CEVE101 > CEVE101.gdb. There are currently no data in this folder.
- Right-click Folders and select Add Folder Connection.
- In the left column click Computer. in the right column double click C: > Users > gistrain(your user). Single click Downloads and select OK.
- In the Catalog pane, expand Downloads.
- Fully expand all folders and geodatabases in the Downloads folder.
- Drag and drop the Major_Rivers feature class into the CEVE101.gdb
- Repeat drag and drop for Wastewater_Outfalls
- Right-click the CEVE101.gdb and select Import > Feature Class

- Click the Browse button to navigate to input features. In the left column click Folders. In the right column click Downloads > Census_2010_By_SuperNeighborhood. Single click Census_2010_By_SuperNeighborhood.shp > SuperNeighborhoods2010Census > SuperNeighborhoods2010Census > CEVE101.shp .
- Type "Census_2010_By_SuperNeighborhood" into the Output Feature Class bar.
- Click Run.
- In the Catalog pane, expand the CEVE101.gdb. There are now three feature classes contained within: Major_Rivers, Census_2010_By_SuperNeighborhood, Wastewater_Outfalls
- Right-click on the Downloads folder. Select Remove.
Adding Data to a Map
- In the Catalog pane on the right, right-click the Census_2010_By_SuperNeighborhood feature class and select Add To Current Map.
- An alternative method of adding data to a map is to click and hold the Major_Rivers feature class and drag and drop it into the Houston Outfalls map view.
- Repeat either method to add Wastewater_Outfalls to the map view.
Symbolizing Layers with a Single Symbol
It is early in the project to be deciding upon symbology, however, when layers are added to a map, ArcGIS Pro assigns then a random color symbol. Sometimes the colors are very faint and difficult to see on top of the basemap or the colors of multiple layers are very similar to each other and difficult to distinguish. To ensure that everyone can easily see the layers we are working with, we will adjust the basic symbology.
...
The super neighborhood polygons are now easy to distinguish from both the basemap and the rivers, while the wastewater outfalls are highly visible in red.

Navigating the Project
Navigating the Contents Pane
At the top of the Contents pane, there is a series of seven buttons. By default, the leftmost button is selected: List by Drawing Order.
...
- Uncheck the Major_Rivers layer to turn off its visibility in the map view.
- Check the Major_Rivers layer to turn its visibility back on in the map view.
Navigating the Map View
You will now learn how to navigate the Map view by panning, zooming, and using spatial bookmarks.
...
| Note |
|---|
The following steps are to be completed on your own. You may use your personal computer (request software by e-mailing gisdata@rice.edu), visit the GDC lab M-F, 9-6PM, or use any of the Fondren Library 1st Floor Rice Computers. To begin where we left off in class, follow the instructions below to download the CEVE101 ArcGIS Pro Project. |
Independent Exercise: Download tutorial project
If you are completing this tutorial from a personal computer, you will need to download the tutorial data online by following the instructions below:
...
The following step-by-step instructions and screenshots are based on the Windows 7 operating system with the Windows Classic desktop theme and ArcGIS Pro 2.1.3 software with an Advanced license. If your personal system configuration varies, you may experience minor differences from the instructions and screenshots.
Exploring Data in the Map View
Selecting Features Manually
Selecting Features Manually from the Map View
- On the Map tab, in the Selection group, click the Select button.
- In the map view, click on any neighborhood to select it.
...
- On the Map tab, in the Navigate group, click the Explore button.
Selecting Features Manually from the Table View
- In the Contents pane, right-click the Census_2010_By_SuperNeighborhood layer name and select Attribute Table.
...
- In the Contents pane on the left, double-click the Census_2010_By_SuperNeighborhood layer name.
- In the 'Layer Properties' window, in the left column, click the third tab, Source tab.
- At the bottom of the window, click to expand the Spatial Reference section.
- Use the scroll bar on the right to scroll to the bottom of the Spatial Reference section to view the metadata.
Within the Spatial Reference section, notice that the geographic coordinate system is WGS 1984 and that no projected coordinate system is listed. Therefore, the layer is unprojected, meaning the data coordinates are located on the three-dimensional surface of the globe and you can see the Angular Unit is listed as Degrees (or decimal degrees.) Therefore, the Shape_Length field is displaying decimal degrees and the Shape_Area field is displaying square decimal degrees, which is why the numbers are so low. Before measuring distance or area, the data layer should be projected onto a two-dimensional surface. The resulting projection will have a Linear Unit, such as feet or meters. The process of projecting is further covered in the Introduction to Coordinate Systems and Projections course.
...
- At the top of the Census_2010_By_SuperNeighbrhood table view, click the Clear button.
- Close the attribute table.
Symbolizing Layers By Attributes
Symbolizing Layers By Quantity
- In the Contents pane, right-click the Census_2010_By_SuperNeighborhood layer name and select Symbology.
- Use the primary 'Symbology' drop-down menu to select Graduated Colors.
- Use the 'Field' drop-down menu to scroll down sixth from the bottom and select the SUM_Vacant field. This field stores the number of vacant housing units within each neighborhood.
...
The map is now displaying the number of vacant housing units divided by the total number of housing units, or the percent vacant housing units. While all these methods of symbolizing the vacant housing units are technically correct This is probably the most common display method.
Adding Layer Transparency
- Ensure that the Census_2010_By_SuperNeighborhood layer is selected.
- In the ribbon, click the Feature Layer contextual Appearance tab.
- In the Effects group, slide the Layer Transparency slider or type "50" and hit Enter.
Symbolizing Layers By Category
- Use the primary 'Symbology' drop-down menu to select Unique Values.
- Use the 'Field 1' drop-down menu to select Name.
- In the Contents pane, collapse the Census_2010_By_Superneighborhood symbology.
Selecting Features Programatically
Selecting Features By Attributes
- In the ribbon, click the Map tab.
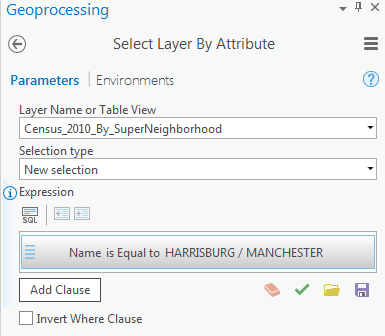
- In the Selection group, click the Select By Attributes button to open the Select Layer By Attribute tool in the Geoprocessing pane.
- In the Geoprocessing pane, click the Add Clause button.
- Use the drop-down menus to build the following expression: Name is Equal to 'HARRISBURG/MANCHESTER' and click the Add button.
- Ensure your Geoprocessing pane appears similar to that below and click Run.
Exporting Selected Features
- In the Contents pane, right-click the Census_2010_By_SuperNeighborhood layer name and select Data > Export Features.
- In the Geoprocessing pane, click the 'Output Feature Class' field to edit the name. Replace Census_2010_By_SuperNeighbor with "Harrisburg_Manchester". Ensure that you leave everything in the file path through CEVE101.gdb\.
Selecting Features By Location
Now we will create a map of the rivers and wastewater outfalls within the Harrisburg/Manchester neighborhood. We could continue to do our mapping within the existing map, but, since we are now focusing on different thematic layers in a different geographic extent, this could be a good time to create a second map within our project.
...
You now have a map of the Harrisburg/Manchester Super Neighborhood with the rivers that intersect it and the wastewater outfalls that lie within it.
...
Presenting and Sharing Maps
Creating a Layout
Once you are finished with your analysis, you may want to create a map that is suitable for adding to a report, presentation, or sharing with others who don't have access to ArcGIS software.
- On the ribbon, click the Insert tab.
- Click the New Layout button.

- If you wanted to create a custom image size for insertion into a report or presentation, you could select Custom pages size at the bottom of the options, but for a full page layout, select Letter 8.5" x 11" at the top left of the options.
- From the Insert tab, click the drop down for Map Frame. Select Neighborhood Outfalls.

More tips for creating a layout are covered in the Map Layouts for Publication short course.
Exporting a Layout
- On the ribbon, click the Share tab.
- Click the Export Layout button.
- On the left, click the Desktop folder.
- Double-click the CEVE101 folder.
- For 'Resolution (DPI)', type "300".
- Click Export.
...