...
- In the Table of Contents, click the rectangle symbol beneath the Subbasin layer name to open the ‘Symbology’ tab.
- On the top of the tab, click Properties.

- For ‘Color:’, use the drop-down menu to select No Color.
- For ‘Outline Color:’, used the drop-down menu to select Black.
- For ‘Outline Width:’, type “2”.
- Click Apply.
...
While you could have also dissolved using the HU_10 field, the watershed name is probably more meaningful to you than the HU_10 code.

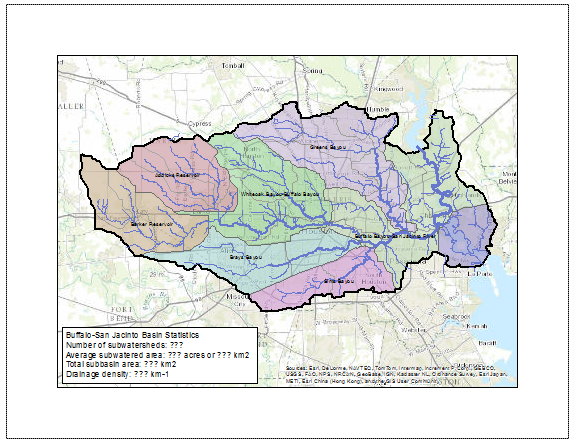
Notice that the subwatersheds from the previous layer have now been grouped into 7 watersheds within the Buffalo-San Jacinto subbasin.
- As before, apply 60% transparency to the Watersheds layer.
- Make sure that the Watersheds layer is selected in Contents and click Labeling under Feature Layer tab on the main tab display.
- Select HU_10_Name in the Field drop-down menu.
- Click the Label icon to turn on the labels.

Depending on your screen size, you may notice the easternmost watershed does not get labeled if there is not adequate space for the required text. This could be adjusted using advanced labeling techniques, but you will leave the map as is.
...
- On the main tab, click Insert -> New Layout -> ANSI Landscape -> Letter.
- Click Insert tab and click Map Frame.
- Select the Lab1 map under Map.

- Select Layout tab and click Activate.
- Right-click Watersheds layer and click Zoom to Layer.
- Select Layout tab and click Close Activation.

Using techniques you learned last week, create a suitable map, as described for the map layout to be turned in below. If you would like to orient the page in landscape, open the ‘Page and Print Setup’ window from the File menu. All map elements, such as text, legends, north arrows, and scale bars can be added to the layout from the Insert menu.
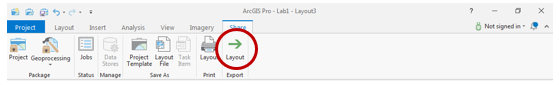
- Select Share Tab and click Export Layout.
- Save your map document.
...
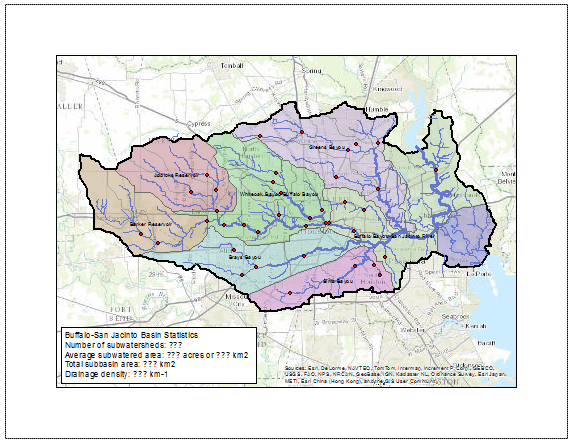
Create an 8.5 x 11 layout clearly deliniating the subbasin and watersheds on top of a basemap, with the symbology and labels corresponding to the watersheds. You may need to further adjust the order of your layers in the Table of Contents and their symbology.

Part 3: Mapping Flowline Data
...
- Ensure your ‘Select by Location’ window appears as shown and click Run.

All of the flowlines catchment areas that are within the subbasin are now selected.
...
- If necessary, go to the Catalog window and click Layouts on top of the map display to get in layout mode.
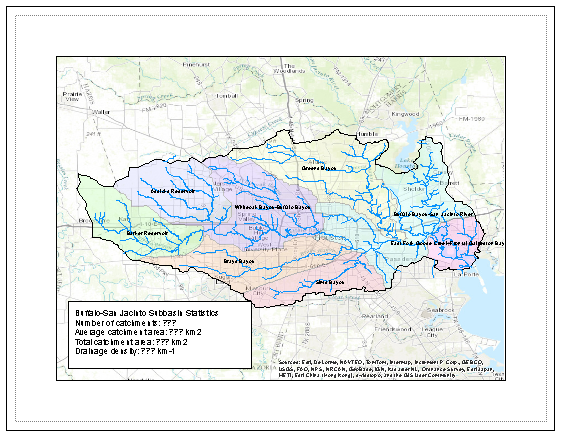
- Click the Insert tab. Select the drop down menu of Text and click Rectangle.

- Drag a rectangle on your map layout to insert a rectangle text element.
...
4) What is the ratio of the total length of the streamlines to the total area of the Buffalo-San Jacinto catchments (called the drainage density) in km-1?
Symbolizing features by quantities using graduated symbols
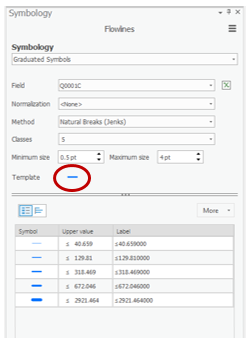
- Open the Flowlines Symbology tab.
- Use Symbology drop down menu to select Graduated symbols.
- Use the ‘Field’ drop-down menu to select the Q0001C field, which contains the mean annual flow.
- Click the line next to Template to change the symbology of your flowlines.
- Save your map document.
...
The flowlines should have graduated symbology based on their mean annual flow.
Part 4: Mapping Stream Gauge Data
...
- In the table of contents, check the StreamGages layer which you brought in at the beginning with the Geographic feature dataset from the NFIEGeo_12 Geodatabase.
- On the Main menu, click Select By Location….
- For ‘Input Feature Layer’, check the StreamGage layer.
- For ‘Relationship’, use the drop-down menu to select within.
- For ‘Selecting Features’, use the drop-down menu to select Subbasin.
- Ensure your ‘Select by Location’ window appears as shown and click Run.

All of the stream gages that are within the subbasin are now selected.
...
The stream gage site locations should be added to the map layout.
Part 5: Mapping Soils Data
...