...
Now you would like to highlight the boundary of the entire Buffalo-San Jacinto subbasin, but, if you tried to change the outline of the current subwatersheds Subwatersheds layer, it would change the outline around all subwatersheds. Instead, you will dissolve all the subwatersheds into a single subbasin feature stored in a new feature class inside your HydrologyLab geodatabase.
...
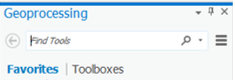
Notice that at the bottom of the Geoprocessing pane pane, you now see the Catalog and Geoprocessing tabs. Any future panes that are opened will create additional tabs at the bottom.
- At the top of the Geoprocessing pane, in the 'Find Tools' boxOn the search bar, type "Dissolvedissolve" and press Enter.
- Click Double-clickDissolve (Data Management Tools).
- In the top right corner of the ‘Dissolve’ window, click question tool pane, hover over the question mark icon.
Read the ‘Dissolve’ window help and review the sample illustration. Notice that this tool dissolves boundaries based on common values in a particular field. In this case, you will dissolve the subwatersheds based on their common subbasin value, resulting in a file showing only the larger subbasin boundary. If you were to click on the question mark icon, it would open up the full Dissolve tool documentation on the ArcGIS Pro help website.
- For ‘Input Features’,For ‘Input Features’, drag in the SubwatershedsNew layer from the Contents pane or select the SubwatershedsNew option from the drop down box.
- For ‘Output Feature Class’, rename the feature class from “SubwatershedsNew“SubwatershedsNew_Dissolve” Dissolve” to “Subbasin”.
- For ‘Dissolve_Field(s)’, select the HUC_8 field, since this is the field containing the common subbasin value you wish to dissolve on.
- Ensure your ‘Dissolve’ window tool appears as shown below, and click Run.


- In the Contents pane, toggle the new Subbasin layer off and on to get a better idea of the result of the Dissolve tool.
- In the Contents pane, right-click the Subbasin layer and select Attribute Table.
Notice that only the dissolve field, in this case the HUC_8 field, was preserved. Because multiple subwatersheds were dissolved into a single subbasin, it is not possible to retain all of the attributes of each separate subwatershed.
- Close the Subbasin attribute table.
In order to see all the layers simultaneously, you will give the subbasin boundary a hollow outline.
- In the Contents pane, click the rectangle symbol beneath the Subbasin layer name to open the ‘Symbology’ tabSymbology pane on the right.
- On Near the top of the tabSymbology pane, click the Properties tab.

- For For ‘Color:’, use the drop-down menu to select No Color.
- For ‘Outline Color:’, used the drop-down menu to select Black.
- For ‘Outline Width:’, type “2”.
- Click Apply.
Now you would like to create a new layer based on the watersheds in the Buffalo-San Jacinto subbasin. In order to facilitate symbolization and labeling of the watershed names, you will now dissolve the subwatersheds into their respective watershed boundaries using the HUC-10 code.
- At the bottom of the Symbology pane, click the Geoprocessing tab.
- For ‘Input Features’, leave the SubwatershedsNew layer previously entered.
- For Repeat steps above, but for ‘Output Feature Class’, rename the feature class from Subbasin to “Watersheds” and for .
- For ‘Dissolve_Field(s)’, checkselect the HUHUC_10_NAME field.
- Click Run.
While you could have also dissolved using the HU_10 field, the watershed name is probably more meaningful to you than the HU_10 code. You no longer need the original subwatersheds layer for this section. The rest of the analysis will be done with the new Watersheds layer.
...
- In the Contents pane, right-click the Watersheds layer and select Symbology.
- Use the In the Symbology pane, use the 'Primary symbology' drop-down menu to select Unique valuesValues.
- Use the ‘Value Field’ ‘Field 1’ drop-down menu to select the HU_10_NAME field.
- Use the ‘Color Scheme’ drop-down menu to select the color ramp of your choice.

...
Notice that the subwatersheds from the previous layer have now been grouped into 8 watersheds within the Buffalo-San Jacinto subbasin.
...
- Export the selected Flowline features into your HydrologyLab geodatabase and name the new feature class “Flowlines”.
- Remove the original Flowline layer from the Contents pane.
- Repeat step 1-7 using Catchment layer as Input Feature Layer and name the new feature class “Catchments”.
- Uncheck the Catchments layer, so it is no longer visible.
- In the Contents pane, click the line symbol beneath the Flowlines layer name.
- In the ‘Symbology’ window under Gallery, select the Water (line) symbol.
- Open the Flowlines attribute table.
- Right-click the LENGTHKM field and select Statistics….
...
You can edit the text and customize the rectangle appearance by double-clicking on the rectangle text element.
- Save your map document project.
FOR MAP LAYOUT TO BE TURNED IN
...
- Open the Flowlines Symbology tab.
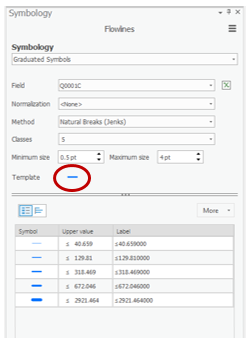
- Use Symbology drop down menu to select Graduated symbols.
- Use the ‘Field’ drop-down menu to select the Q0001C field, which contains the mean annual flow.
- Click the line next to Template to change the symbology of your flowlines.
- Save your map document.
...
- In the Contents pane, check the StreamGages layer which you brought in at the beginning with the Geographic feature dataset from the NFIEGeo_12 Geodatabase.
- On the Main menu, click Select By Location….
- For ‘Input Feature Layer’, check the StreamGage layer.
- For ‘Relationship’, use the drop-down menu to select within within.
- For ‘Selecting Features’, use the drop-down menu to select Subbasin.
- Ensure your ‘Select by Location’ window appears as shown and click Run.

...
Notice that the ‘Output Feature Class’ did not default to your HydrologyLab geodatabase, but instead to the default geodatabase that was referenced in the map package you downloaded.
- Rename Output Feature Class to “Soils” “Soils” and click Run Run.
Notice that the resulting Soils layer maintains the soil class boundaries, but limits the extent of the soils layer to the extent of the subbasin boundary. You no longer need the master Map Units layer and may remove it.
- In the Contents pane, right-click the Map Units layer and select Remove Remove.
- Open the Soils Symbology pane.
- Click Graduated colors.
- Use the ‘Field’ drop-down menu to select the Available Water Storage 0-100 cm – Weighted Average field.
...
Deliverables
- Create an 8.5 x 11 layout with the following layers limited to the subbasin:
- Subbasin – hollow outline
- Watersheds – categorical symbology and labeled
- Flowlines – graduated symbology
- Stream gages – point symbol
- Basemap
...
Include a text box in the layout containing the answers to the following questions:
...
- How many HUC-12 catchments are there in the Buffalo-San Jacinto Basin?
...
- What is their average area in km2?
...
- What is the total area of this subbasin in km2?
...
- What is the ratio of the length of the streamlines to the area of the Buffalo-San Jacinto subbasin (called the drainage density) in km-1?
2. Create an 8.5 x 11 layout with the following layers limited to the subbasin:
- Subbasin – hollow outline
- Soils – graduated colors
Include a text box in the layout containing the answers to the following questions:
...
- What is the average available water storage (cm) in the Buffalo-San Jacinto subbasin?
...
- Based on your previous calculation of the area of the subbasin in km2, what volume of water (km3) could potentially be stored in the top 1 m of soil in the Buffalo-San Jacinto subbasin if the soil were fully saturated with water?