...
- In the Contents pane, right-click the Watersheds layer and select Symbology.
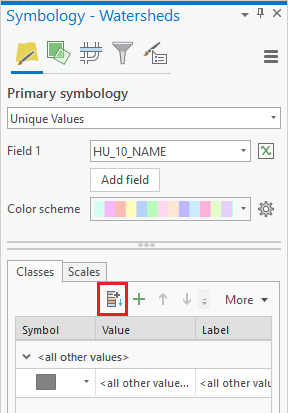
- In the Symbology pane, use the 'Primary symbology' drop-down menu to select Unique Values.
- Use the ‘Field 1’ drop-down menu to select the HU_10_NAME field.
- Use the ‘Color Scheme’ drop-down menu to select the color ramp of your choice.

- On the bottom half of the Symbology pane, if only one category called <all other values> is listed, as shown below, click the Add all values button.
...
- On the ribbon, click the Insert tab.
- In the Project group, click the New Layout button and, under the 'ANSI - Landscape' section, click Letter 8.5" x 11".
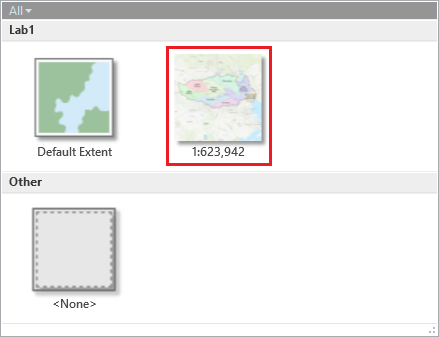
- On the ribbon, click the Map Frame group and, under the 'Lab1' map section, click the map frame select the second frame that is labeled with the scale listed, such as 1:600,000.
- Select Layout tab and click Activate.
- Right-click the Watersheds layer and click Zoom to Layer.
- Under the 'Rice Bus Routes' map section, select the second frame that is labeled with a scale, such as 1:600:000.
- Click and hold near the top left corner of the layout page and drag the rectangle near the bottom right corner or the layout page.
- In the Contents pane, right-click the Watersheds layer and select Zoom to Layer.Select Layout tab and click Close Activation.

Using techniques you learned last week, create a suitable map, as described for the map layout to be turned in below. If you would like to orient the page in landscape, open the ‘Page and Print Setup’ window from the File menu. All map elements, such as text, legends, north arrows, and scale bars can be added to the layout from the Insert menutab on the ribbon.
- Select Share Tab and click Export Layout.
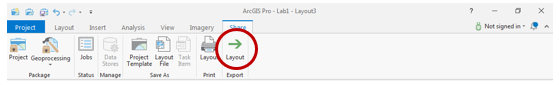
- On the ribbon, click the Share tab and click the Layout button in the Export group to open the Export Layout pane on the right.
- In the Export Layout pane, use the 'File Type' drop-down menu to select PDF.
- For 'Name', type "Lab 1 Watersheds" and click Export.
- Save your projectSave your map document.
FOR MAP LAYOUT TO BE TURNED IN
Create an 8.5" x 11" layout clearly deliniating delineating the subbasin and watersheds on top of a basemap, with the symbology and labels corresponding to the watersheds. You may need to further adjust the order of your layers in the Contents pane and their symbology.
...
Next, you will add flowlines to your map, which were previously downloaded from NFIE.
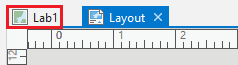
- At the top left of your Layout view, click the Lab1 map tab to return to your map view.
- In the Contents pane, check the Flowline and Catchment layers to make them visible.
...
Now you would like to select out only the flowlines and catchments within the Buffalo-San Jacinto subbasin, but this is not possible with an attribute query, so you will instead use a spatial query.
- On the ribbon, click the Map tab.
- In the Selection group, click the Select By Location button Main menu, select Select By Location….
- For ‘Input Feature Layer’Features’, use the drop-down menu to select Flowline.
- Use the second 'Input Features
- For ‘Relationship’, use the drop-down menu to select "Have their center in".
- For ‘Selecting Features’, check the Subbasin layers.
...
- Export the selected Flowline features into your HydrologyLab geodatabase and name the new feature class “Flowlines”.
- Remove the original Flowline layer from the Contents pane.
- Repeat step 1-7 using Catchment layer as Input Feature Layer and name the new feature class “Catchments”.
- Uncheck the Catchments layer, so it is no longer visible.
- In the Contents pane, click the line symbol beneath the Flowlines layer name.
- In the ‘Symbology’ window under Gallery, select the Water (line) symbol.
- Open the Flowlines attribute table.
- Right-click the LENGTHKM field and select Statistics… Statistics….
Symbolizing features using a single symbol
...
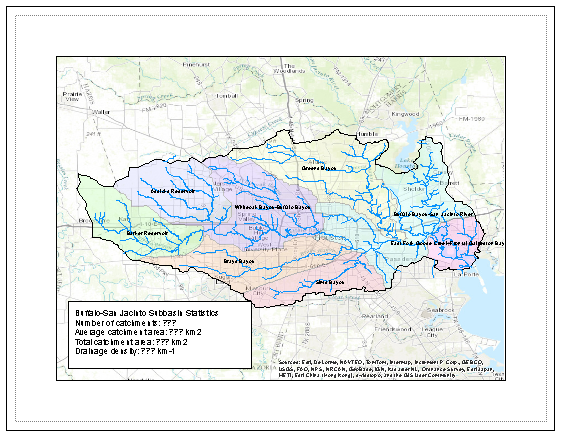
Add a text box to the layout containing the answers to the following questions:1)
- How many catchments are there in the Buffalo-San Jacinto subbasin?
...
- What is their average area in acres and in km2?(Look up conversion factor.)
...
- What is the total area of catchments in km2?
...
- What is the ratio of the total length of the streamlines to the total area of the Buffalo-San Jacinto catchments (called the drainage density) in km-1?
Symbolizing features by quantities using graduated symbols
...