...
From the Chart Properties pane on the right, you can see there are 543 flowlines in the Buffalo-San Jacinto basin whose average length is 1.94 km and total length is 1052 km.
- Calculate View the statistics on for the AreaSqKM AreaSqKM field in the Catchments attribute table.
Based on the statistics you have just seen, calculate the answers to the questions listed for the map layout to be turned in on the following pagebelow. In order to add the statistics to your map layout, you will insert a rectangle text element.
- If necessaryAt the top left of your map view, go to the Catalog window and click Layouts on top of the map display to get in layout mode.click the Layout tab to return to your layout view.
- On the ribbon, clickClick the Insert tab. Select the drop down menu of Text and click Rectangle.

- In the Graphics and Text group, click the Rectangle text button.

- Drag a rectangle on your map layout to insert a rectangle text element.
You can edit the text and customize the rectangle appearance by double-clicking on the rectangle text element and using the 'Format Text' Element pane on the right.
- Save your project.
FOR MAP LAYOUT TO BE TURNED IN
...
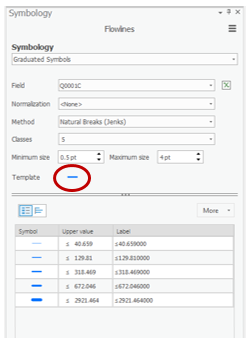
Symbolizing features by quantities using graduated symbols
- Return to the Lab1 map view.
- Open the Flowlines Symbology tab.
- Use Symbology 'Primary Symbol' drop down menu to select Graduated symbols.
- Use the ‘Field’ drop-down menu to select the Q0001C field, which contains the mean annual flow.
- Click the line next to Template to change the symbology of your flowlines.
- Save your map document project.
FOR MAP LAYOUT TO BE TURNED IN
...