TABLE OF CONTENTS
This guide was created by the staff of the GIS/Data Center at Rice University and is to be used for individual educational purposes only. The steps outlined in this guide require access to ArcGIS Online software and data that is available both online and at Fondren Library.
The following text styles are used throughout the guide:
Explanatory text appears in a regular font.
- Instruction text is numbered.
- Required actions are underlined.
- Objects of the actions are in bold.
Folder and file names are in italics.
Names of Programs, Windows, Panes, Views, or Buttons are Capitalized.
'Names of windows or entry fields are in single quotation marks.'
"Text to be typed appears in double quotation marks."
The following step-by-step instructions and screenshots are based on the Windows 10 operating system and ArcGIS Online software with an Advanced license. If your personal system configuration varies, you may experience minor differences from the instructions and screenshots.
Logging into Rice's ArcGIS Organization
Note: In order to use ArcGIS Online through Rice University, you must have a valid NetID and access to Duo Secruity.
OPTION 1: Login through Arcgis.com
- Go to https://www.arcgis.com.
- Click 'sign in'.
- Select "Your ArcGIS Organization's URL".
- Type in 'ricegis' for Your ArcGIS Organization's URL and click continue.

- Click on 'Rice University' and log in with your NetID and NetID password. You will be prompted by Duo security.
OPTION 2: Login through Ricegis.map.arcgis.com
- Go to https://ricegis.maps.arcgis.com/.
- Click "Rice University" and log in with your NetID and NetID password. You will be prompted by Duo security.
Getting Started with ArcGIS Online
The ArgGIS Homepage
Navigating the Homepage
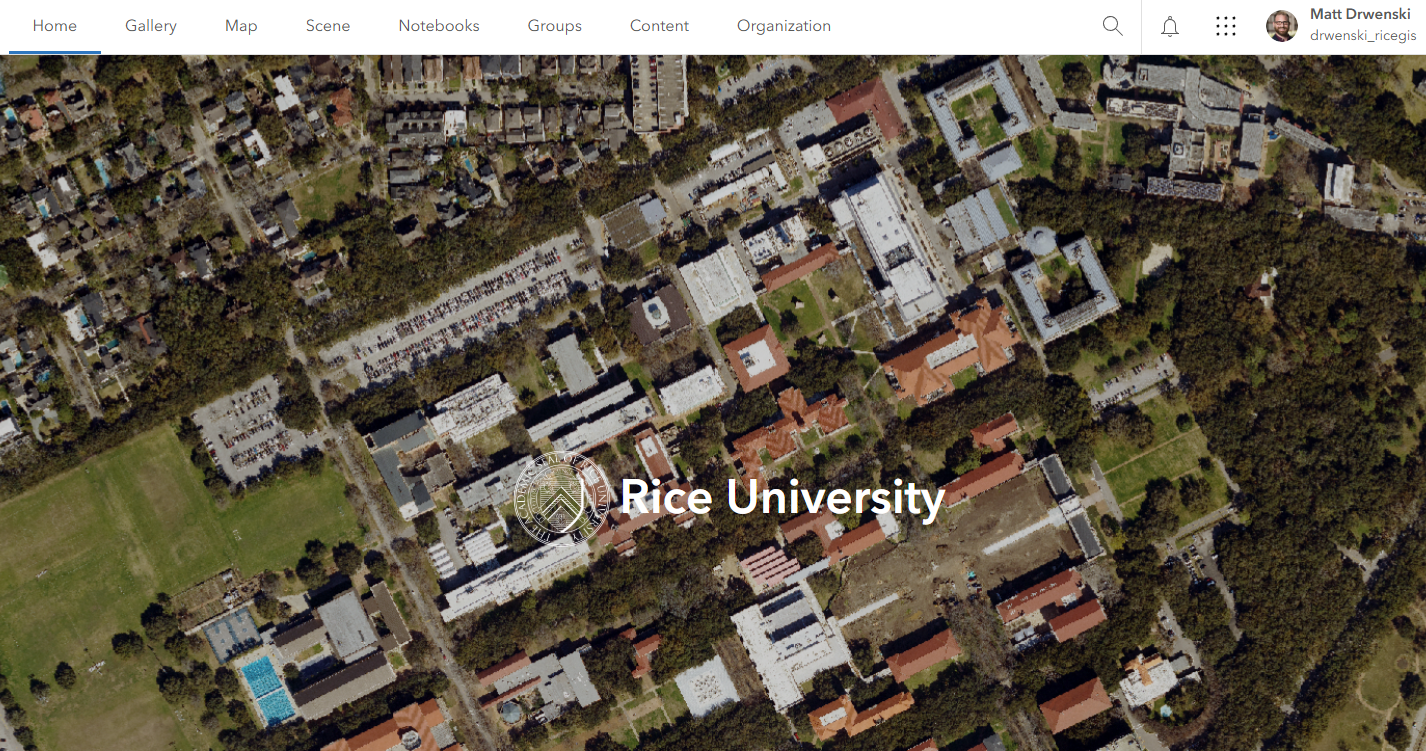
Once you are signed into ArcGIS Online, you will see our organization's homepage, the header ribbon, and your ArcGIS Online account (see example below).
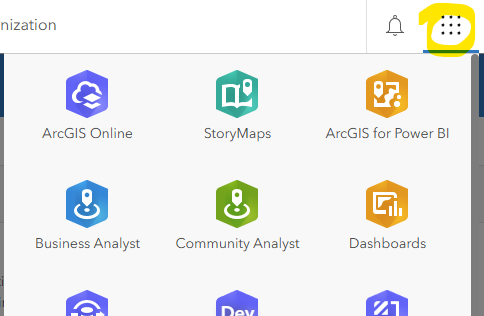
- On the ArcGIS Home page, click the Application Waffle (9 dots in a grid) to open the app options. Here you can view the available apps associated with the Rice University ArcGIS organization. Of note for beginners is StoryMaps (Getting Started with ArcGIS StoryMaps tutorial), a great tool for presenting a narrative around your maps and data, and Living Atlas, a collection of high quality geographic data that you can use to build your maps.
- On the top ribbon are the Groups and Content. Groups is for collaborative work and data sharing and content is where all the maps and data that you, Rice, and all of ESRI have created.
- Last, click the magnifying glass symbol (🔍) to conduct a quick Search of available content. Type "Houston" and hit Enter to search.
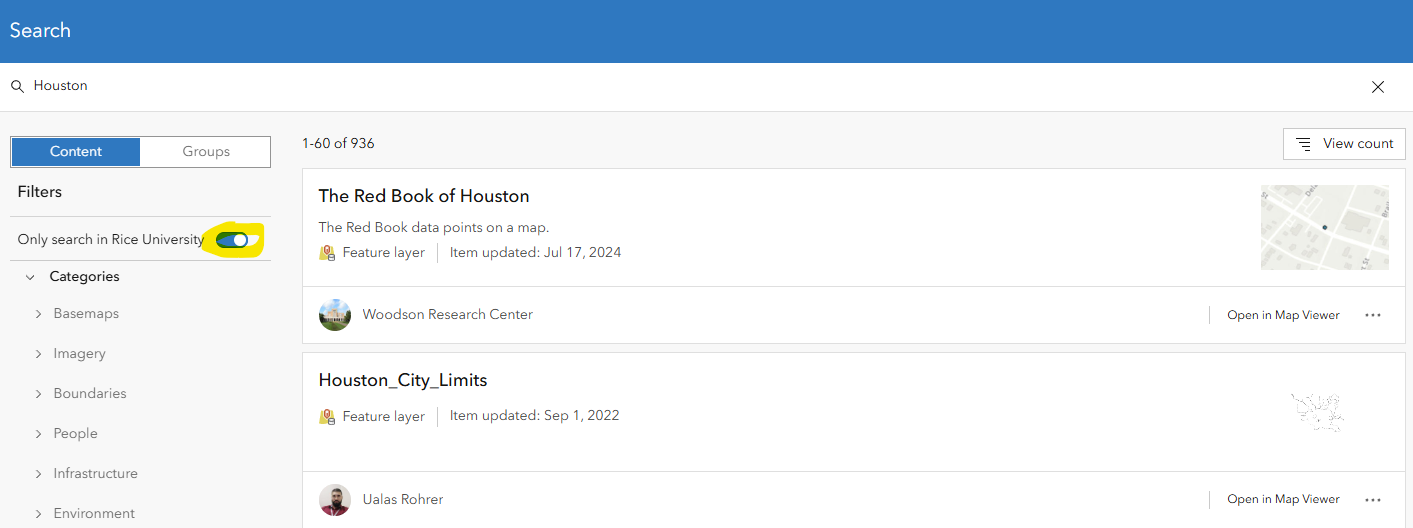
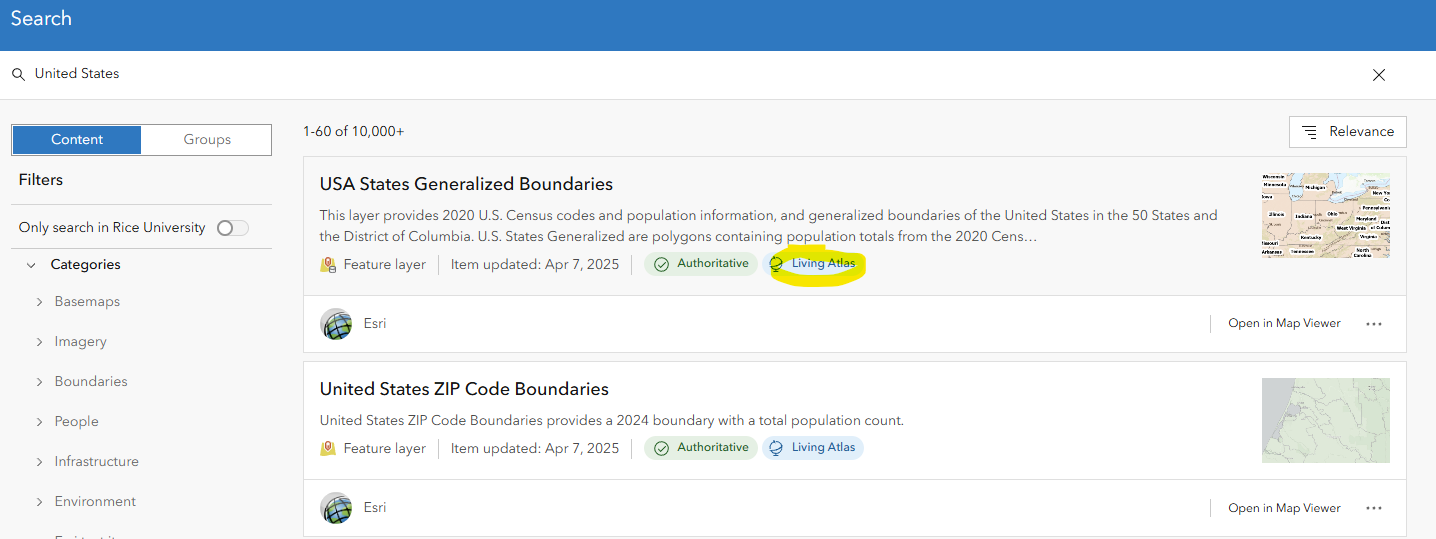
Uncheck the "Only search in Rice University" toggle to view the whole universe of content and data in ArcGIS Online. Try the search again with your own keyword(s). Note that you can filter by item type, sort by Relevence, Date, and popularity.
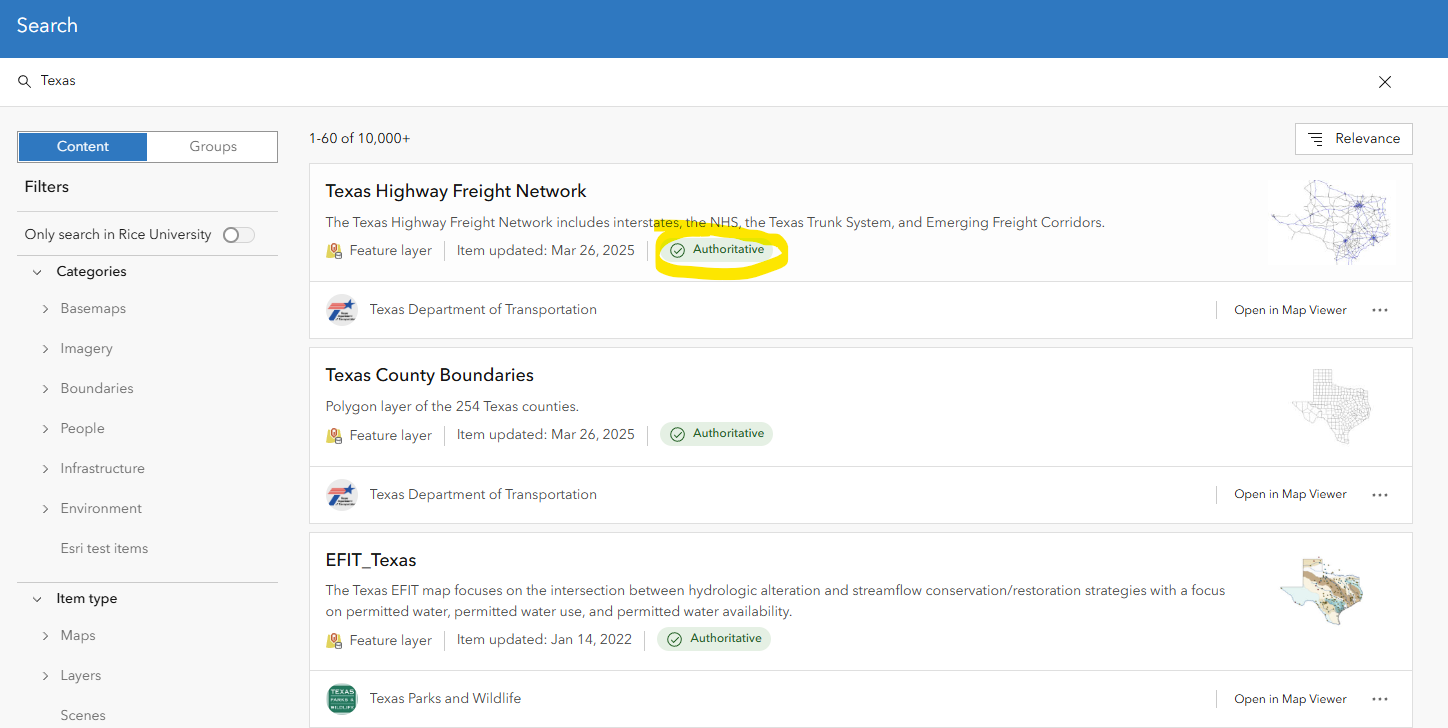
Some data is marked as "Authoritative", meaning it has been flagged as coming from a reliable source. Author content is marked with the "Living Atlas" flag, which shows it is part of ESRI's curated collection of updated data.
Searching for Data on the ArcGIS Living Atlas
What is the Living Atlas? The Living Atlas is curated set of geospatial data, managed and distributed by ArcGIS's parent corporation, Esri. It includes basemaps, commonly-used geospatial layers, live data, satilite imagery, and more. Anyone can upload data and maps to ArcGIS Online, but the content in the Living Atlas is well-documented and comes from a reliable publisher of geospatial data, like a government agency.

Searching the Living Atlas
You can search the Living Atlas in detail by
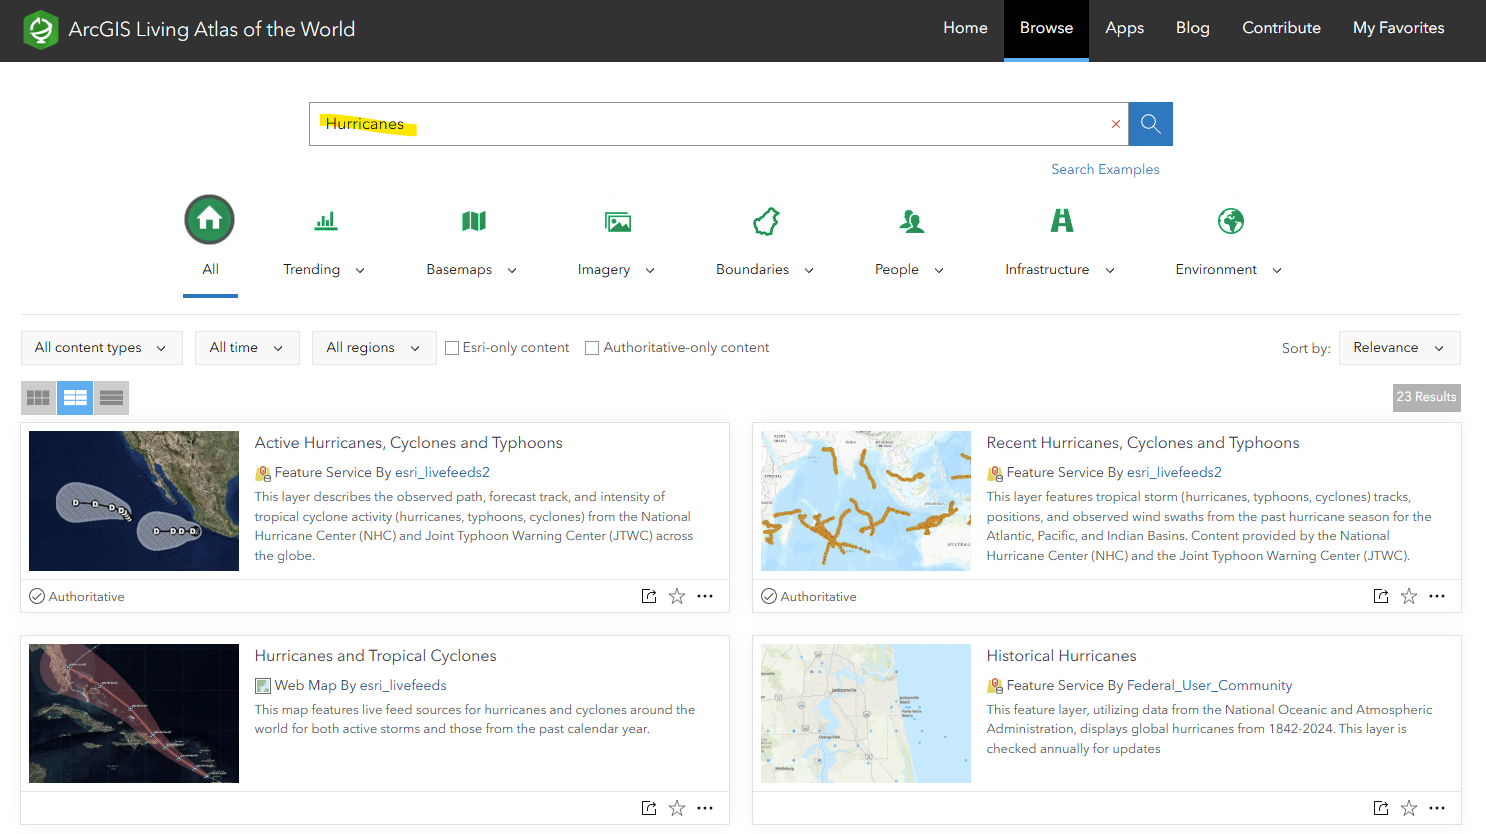
- From the ArcGIS Online home page, click the Application Waffle (9 dots in a grid) and scroll down to select Living Atlas (green globe icon).
- Use the keyword search bar to search the titles and descriptions of items in the Living Atlas. For example, search "hurricanes" to display an active global urricane tracker, historical hurricane paths, and hurricane risk by US Census tracts.
- Next, search your own keywords. If you are stuck, try "hydrography," "demographics," "imagery," or "temprature."
- Click the title of any of the iteams in the gallery below your search to view the full details and description of the item.
You can also filter your search using the to filter your results by type or theme.
Creating Your First Map
Navigating ArcGIS Web Maps
Zooming and Search Web Maps
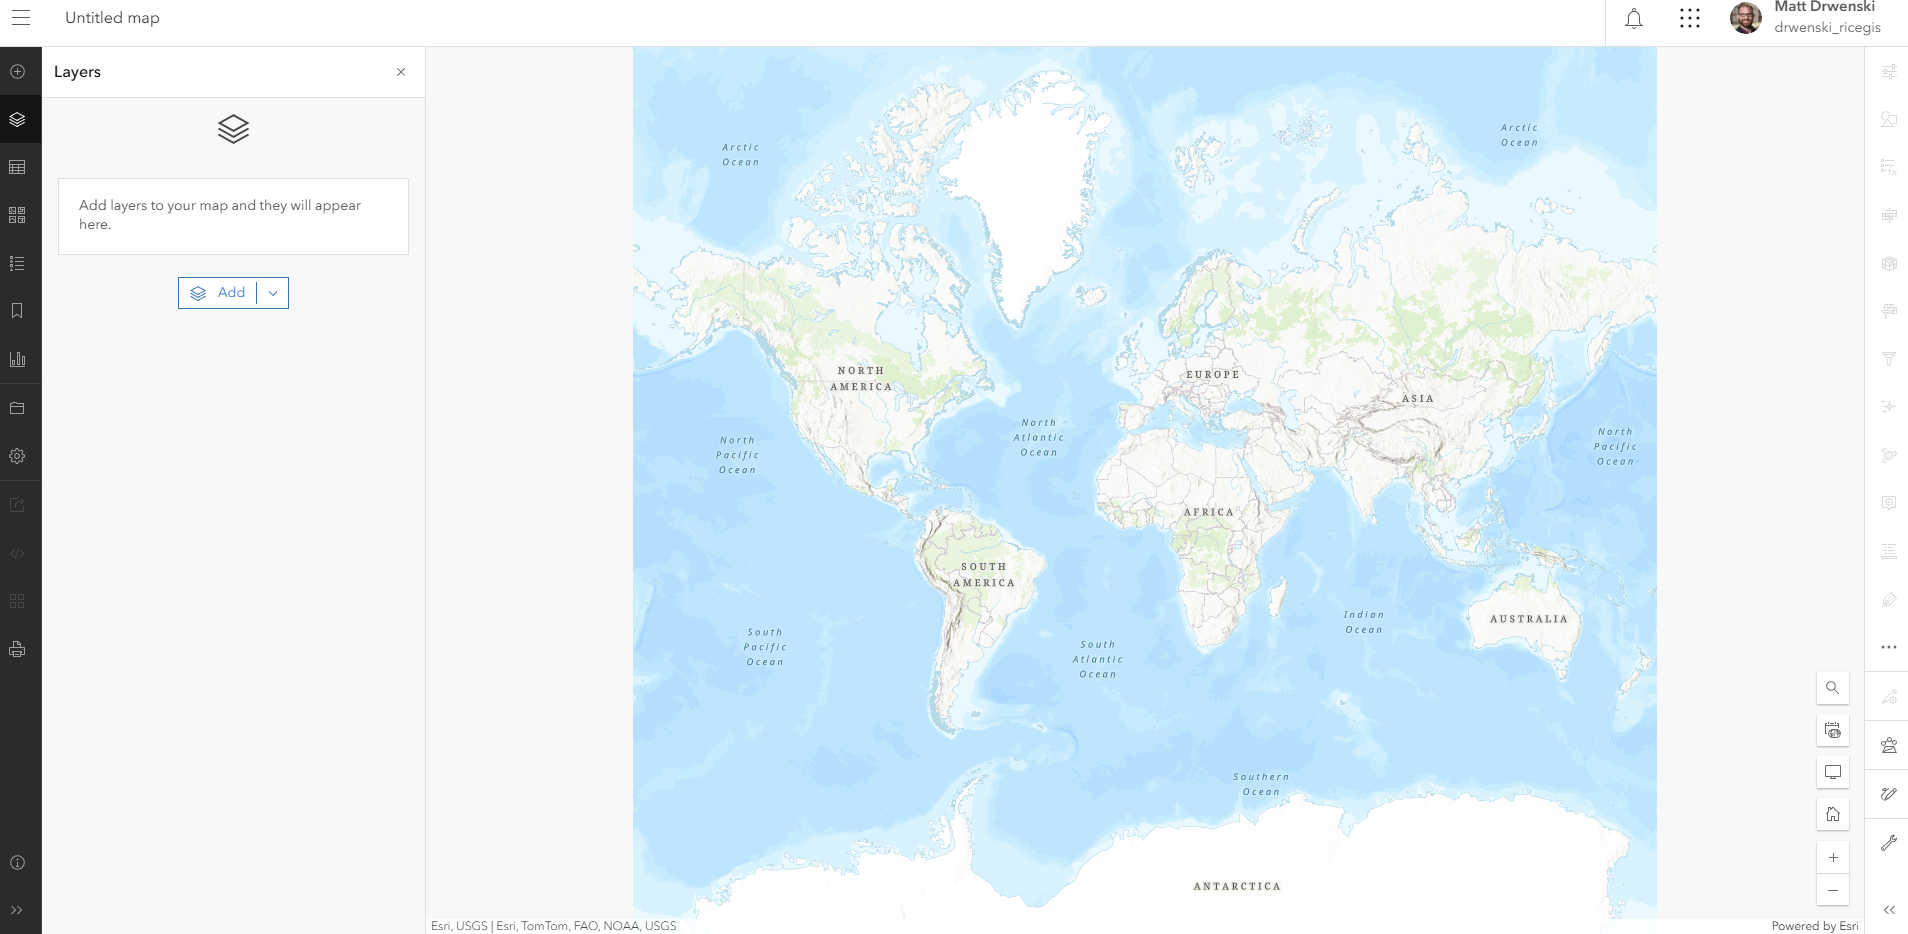
- From the ArcGIS Online home page, Click the Maps button in the top ribbon to open your first Web Map. In this section we will go over how to navigate the map and the location of the basic functions.
- Use the mouse wheel scroll to zoom in or out and click and drag to the view. You can also use the "+" and "-" buttons in the bottom right of the screen. Try all three.
- Rotate the map by right clicking and moving the mouse. Reset by clicking the compass button.
- To set a more precise extent, hold down the shift key, then left click and drag a rectangle around the United States. This sets the extent of the map as close as possible to the retangle drawn.
- On the lefthand (dark) menu, select the Bookmark icon (6th from the top). Click "+Add bookmark" and title it "United States."
- What if we need to find a location we are unfamiliar with? Click the search ("🔍") button on the bottom left of the map and type "Amarillo" into the search box. This will use ArcGIS Onlines native geocoding feature to find a match for your search words. You can search geographic places, addresses, and even businesses.
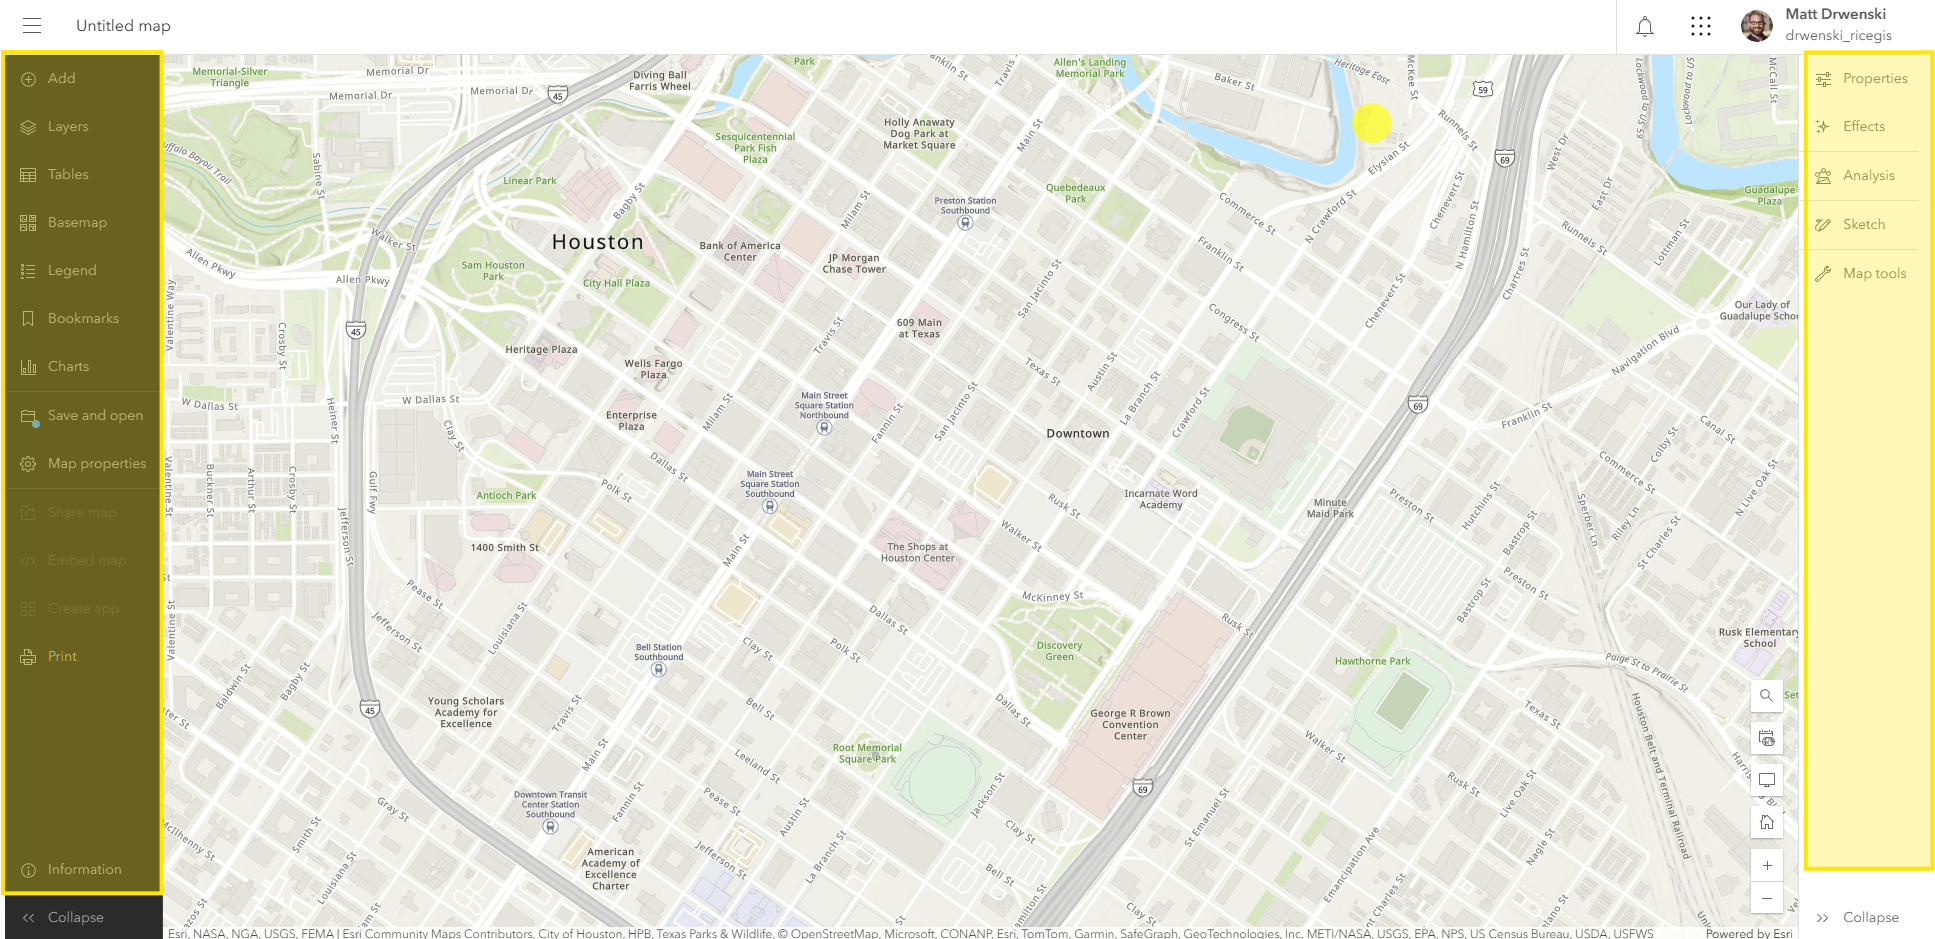
Lefthand and Righthand Menus
Overall we have two main menus in ArcGIS Online, the lefthand (dark) menu which generally applies to the whole map, and the righthand (light) menu which has specific functions based on what is currently selected. Both can be expanded and collapsed using the Expand/Collapse ">>" arrows at the bottom corners of the page.
On the lefthand (dark) menu, you'll notice a blue dot on the "Save and open" button. This appears when we've modified the map but not yet saved our changes. Since ArcGIS Online is browser-based, none of changes are saved until you save your project. Save your project now, but clicking the Save and open button and selecting Save as. Give your map a title, "Introduction to ArcGIS Online." You can add tags, categories, and descriptions to maps, or come back and add these later.
The righhand (light) menu, is contextual, it's options change based on what you have selected in the data sections of the righthand menu.
Scetch Layers
Let's add our first item to the map: a sketch layer. Sketch layers allow you to quickly add points, lines, or polygons to mark points of interest. You can also add text to the map. Unlike other layers, sketch layers are not permanent data layers and cannot be exported to other maps. Think of them as quickly drawing on top or your map when you need add a quick label or point of interest.
- Click the "+" button in the righthand menu, then click "Create Sketch Layer."
- Add a Pin for Fondren Library (use either the Search funciton or pan and zoom to it on the map). Add a Pin for your dwelling, college, or favorite restaurant.
- Add Text for Rice University
- Editing the Sketch Layer. Click the "Select" or "Select by rectangle" buttons in the sketch menu located on the right of the map display to configure already placed points.
- Add a "Pop-up". title in the "Pop ups" section. Add an image from a web-hosted layer.
Adusting Visibility Range, Transparency and Hiding Layers
Note that as you zoom out, click your United States bookmark, the labels you have created become jumbled and inappropriate for this scale. You may also notice that your pins or text obscure important details you may want visible. You can solve this problem by adjusting the visibility and transparency of your sketch layer.
- First, select your "Sketch" layer by clicking on its name in the layer menu. You can tell that it's selected when it's name is in bold font and a blue bar appears to the left of the name.
- Then, open the properties menu on the righthand (light) menu in the upper righthand of the screen.
- Scroll down until you can see the Appearance and Visibility submenus.
- On the Visibility menu move the minimum and maximum endpoints to adjust at what scale your layer will be displayed. The black triangle shows your current scale. Note that when you are outside the minimum or maximum of the visible range, the name of your layer becomes grayed out.
- Under the Blending menu, you can adjust the overall Trancparency of the layer by dragging the transparency slider or by clicking the percentageand typing the desired percentage. Enter 50%.

Last, it's very useful to turn off the visibility of layers that you are not actively working on. In the Layers lefthand (dark) menu, you can hide a layer by hovering over its name and clicking the "Hide Layer" (eye "👁" symbol) that appears. Your layer is still part of the map but its visibility is disabled until you click the 👁 button again.
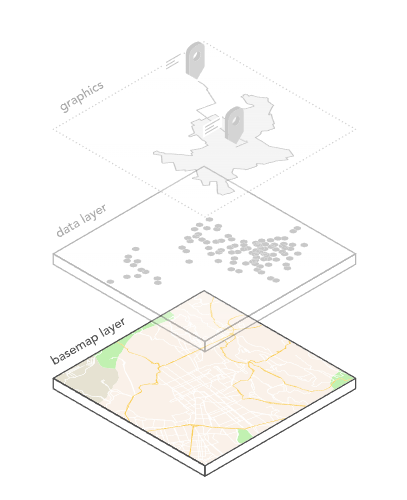
Modifying the Basemap
The basemap is a background reference image that provides context for your data. The basemaps here are created by Esri.
- Click the fourth "Basemap" button
 on the lefthand (dark) menu.
 - Select a new basemap for your Web Map from the list provided.
- Click the eye icon next to "Current basemap" to toggle the visibility of any basemap off and on.
When selecting a basemap, consider the purposes and themes of the map, for some maps an imagery basemap might be best, for others a basemap with detailed roads and naviagtion features might be appropriate. For your training, select a neutral basemap, such as "Light Gray Canvas" so that we can focus on the data you will add to the map.
Adding Data to a Map
Adding data is the best way to use publicly available data or ready-map information for visualization or analysis. In subsequent trainings, you will learn how to add your own data ArcGIS Online.
- To search for data, on the righthand menu, click the "Add +" button and then click "Browse Layers"
- Select "Living Atlas" from the dropdown list.
- Type or copy "ACS Vehicle Availability" into the search box and add the first layer in the results, "ACS Vehicle Availability Variables - Boundaries".
- Click the "+ Add" button in the bottom righthand of the layer preview.

Your map now has this collection of geospatial layers with attached data on vehicle availability collected from the American Community Survey. Let's explore how to look at this dataset in ArcGIS Online. Then, we will prepare this data for a map that visualizes Harris County, Texas.
- Expand the layer group. Our data is in three seperate layers, one for States, another for Counties, and final one for Census Tracts.
- Zoom in and out and the map. Notice how one layer displays on the map and in the layer list become bold.
- Explore what's in a layer. Click the layer name States and then click the three "Options" dots to the right of the layer name "•••".
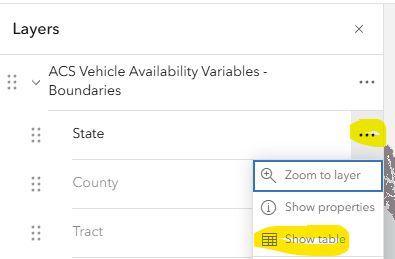
This data is feature layer. The layer contains shapes or polygons (the States of the U.S.) and data attached to each of these shapes. With the table open, you can see that it's organized like spreadsheet: each row represents a polygon (State) and each column represents a field of the data (such as "state Name, Total Households, etc.). Scroll down to see more of the states until you reach Texas to the scroll right to see more of the fields in this layer until you find Total Households. You can see that that there are over 10 million households in Texas.
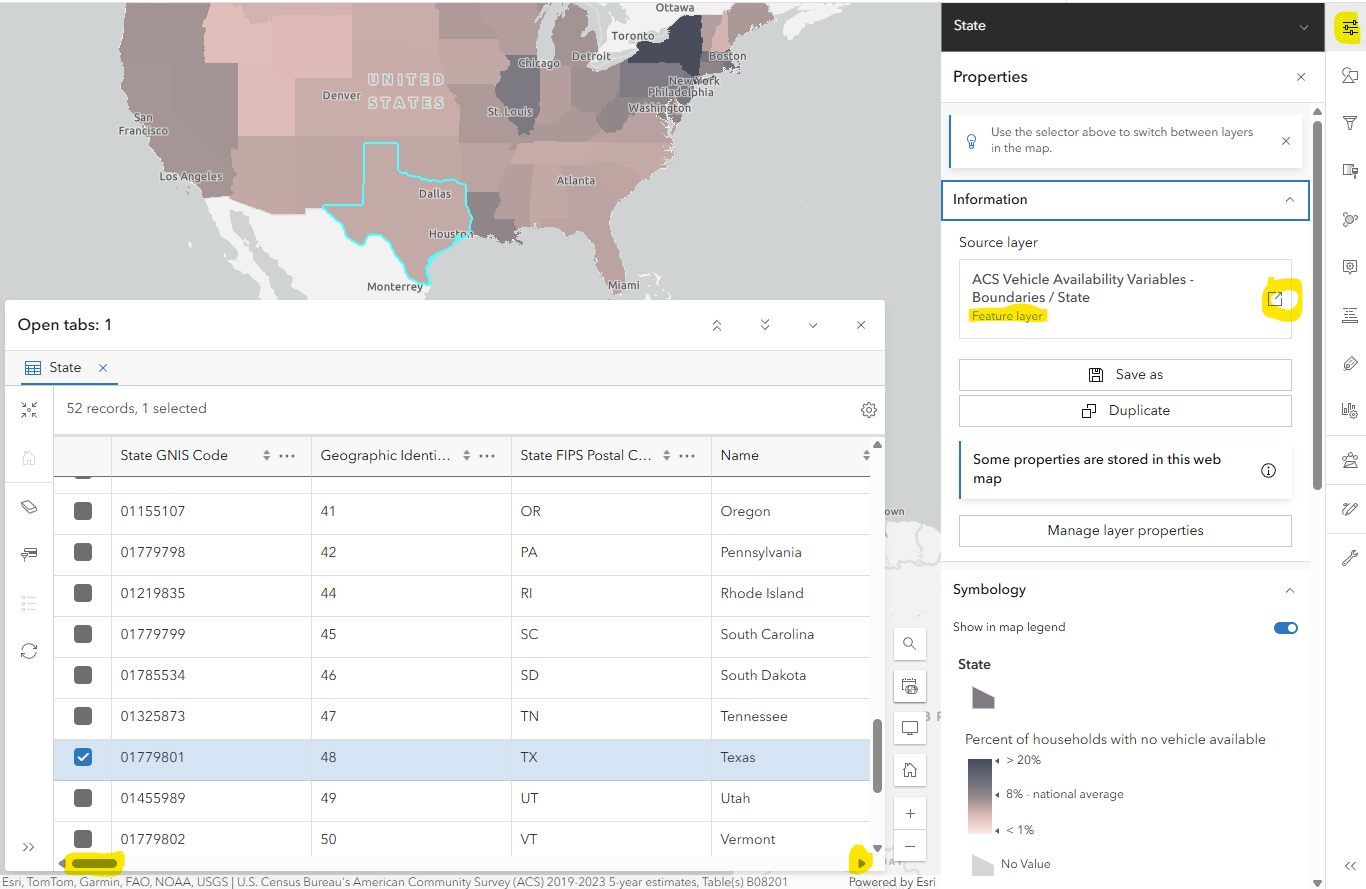
Click the properties button (first button on the righthand (light) menu with the layer selected) and expand the Information submenu. Under Source layer click the name "ACS Vehicle Availability Variables - Boundaries / State" to open the details page for this layer.
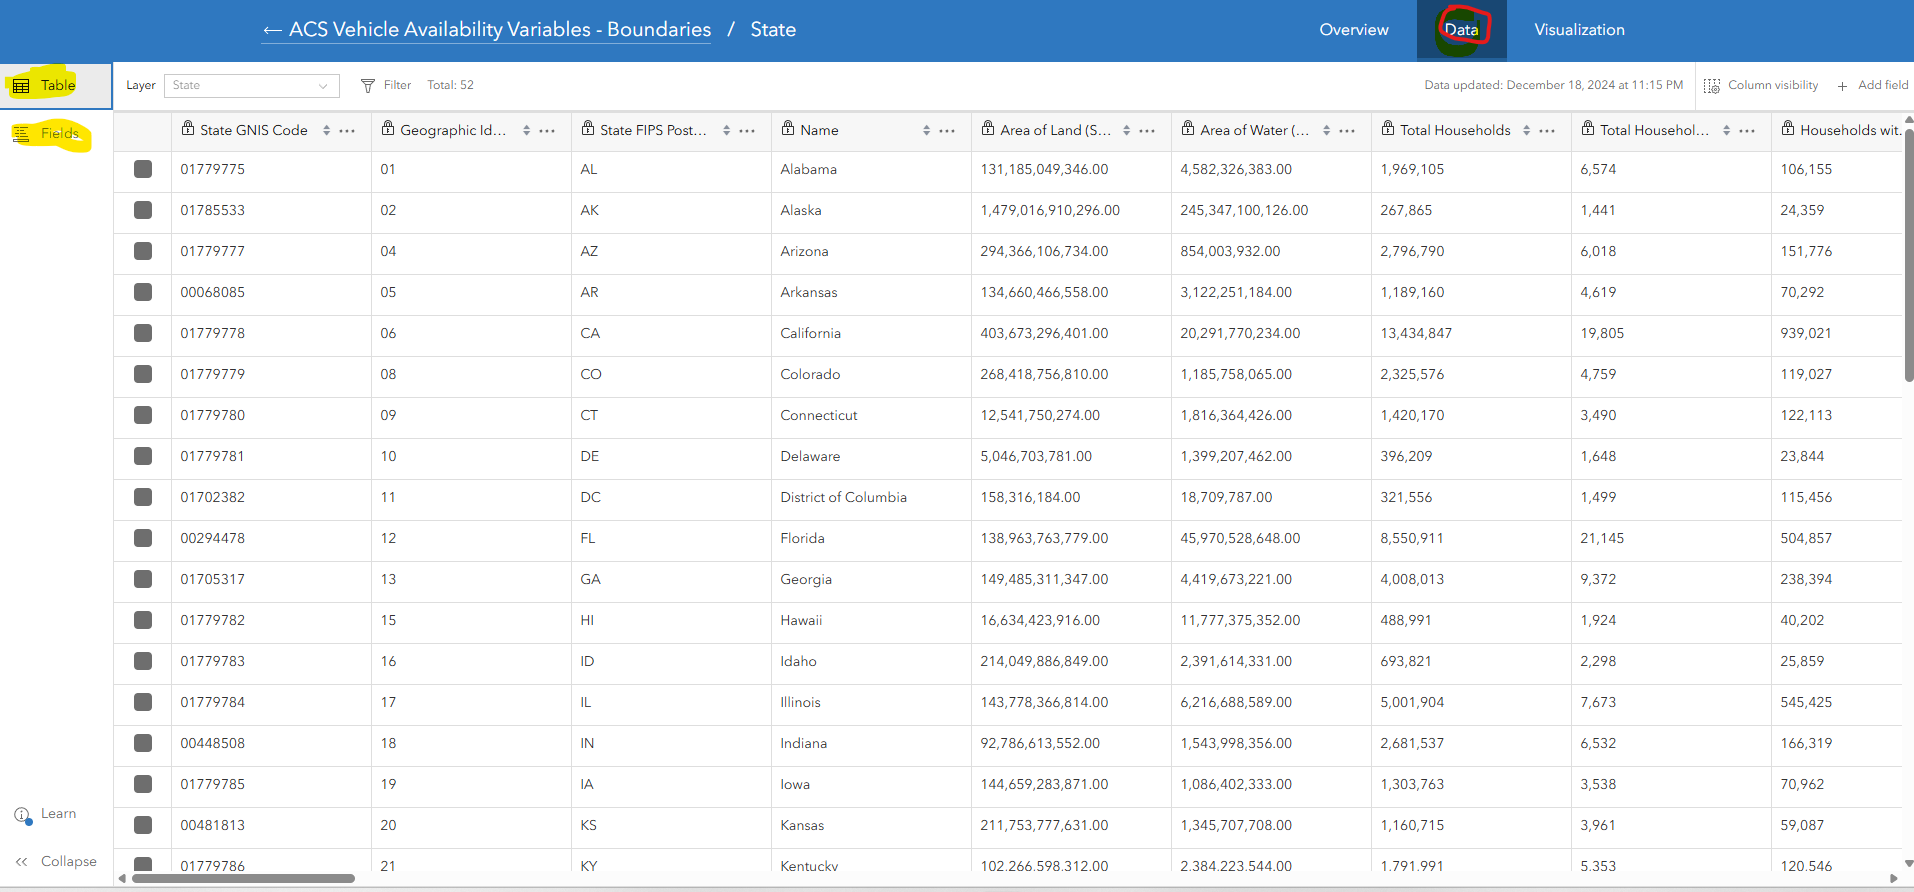
Here you can see any additional metadata (description, owner, acknoledgments, etc.) and by moving to the Data seciton in the top ribbon, you can explore the table in a full page fiew as well as read through a list Fields (button on the left) and see if the field is identifier, a string (text), or a numberic value (Integer, or Double) as well as its value type. ArcGIS treats each of these field types differently and allows you to run different types of vizualizations and analysis on different field types. Here, in the Table view, you can also quickly sort by each field, filter fields, or hide columns.
A Polygon feature layer, like this layer of States, is just one type of geospatial data. As you progress in your training, you'll also in points (emission sites or trees, for example), in polylines (streets or rivers, for example), or polygons (congressional districts or

Organizing Layers
You may have noticed that the scope of this group of layers with data on Vehicle Availibility goes well beyond our goal of a vizualization of Harris County, Texas. In order to trim and focus our data, we will group our layer, rename our layer, and run a filter on our layer.
Grouping and Ungrouping Layers
Renaming Layers
Removing Layers
You can also duplicate a layer
Create a filter and Adust Visibility
Visualizing Data
Duplicate Layer, Rename Layer (Total Households)
Select a Field
- Example: Total Area
- Example: Total Households
- Useful! Let's Duplicate and Save
- Example No, 1, 2, 3, 4+ Vehicles
- Show the "auto-pick" of the symbology
- Example: No Vehicle Available
- Modify
- Gradiatn Colors, Style Options
- Theme, High-to-Low, Above-and-Below
- Color Scheme
- Histogram of Data
- Classify Data
- Add a normalization field. Divide by Total Households
What's in a Layer?
- Open the Layer Attribute Table
- Use the table to find the 10 highest values for the Percent of households with no vehicle available field.
These tracts have values above 36.8 percent. - Add a Filter to highlight important data
Quickly Add another Layer
- "COH Metro"
Play around with Styles
- Gradiatn Colors
- Theme
- Color Scheme
- Classify Data
Save and Sharing Settings
Breakout Room
- Go to “Living Atlas” and search “ACS”
- Create a new map by and repeat what we did with a topic and location of your choice.
- Be ready to share with your partner and the class.
ACS
Part II: Adding Data
Georeferencing LatLong Data
Add a new Item
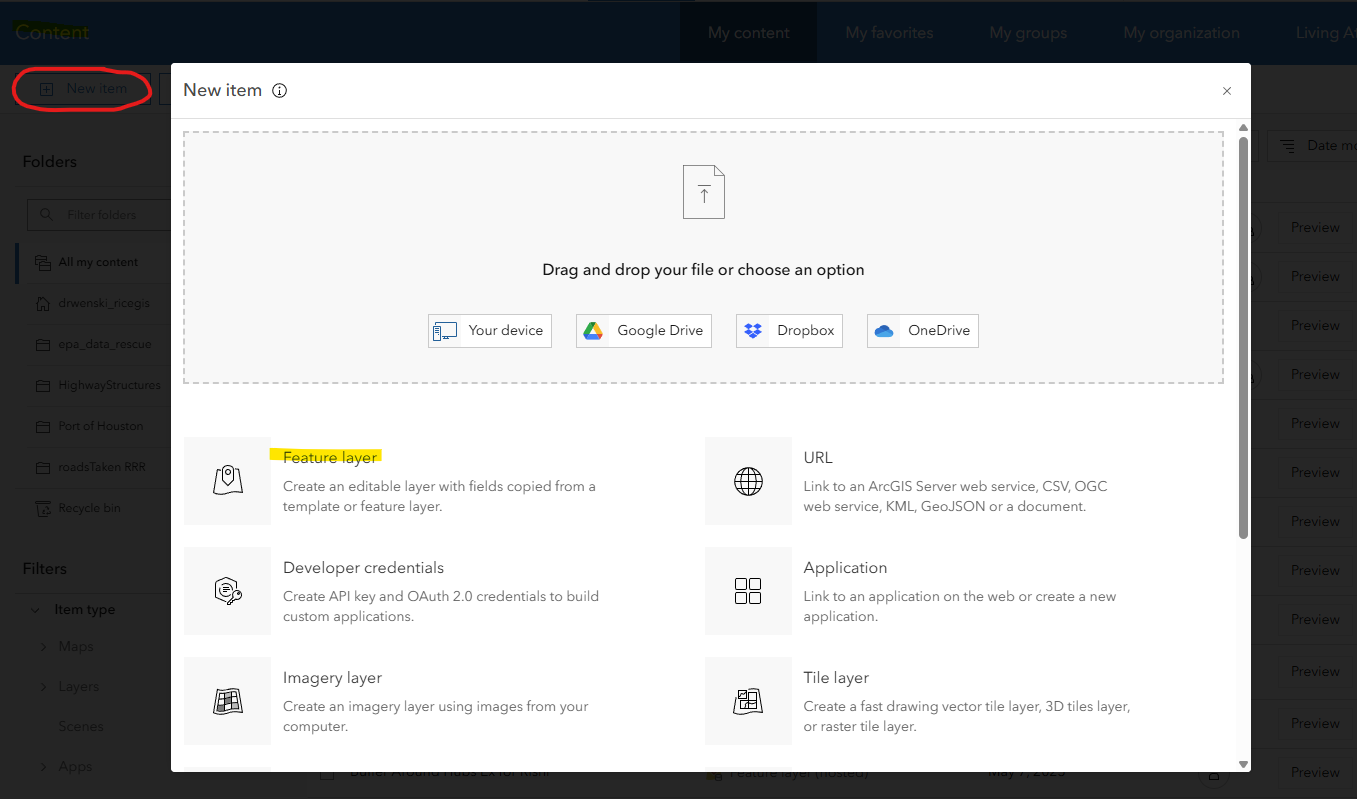
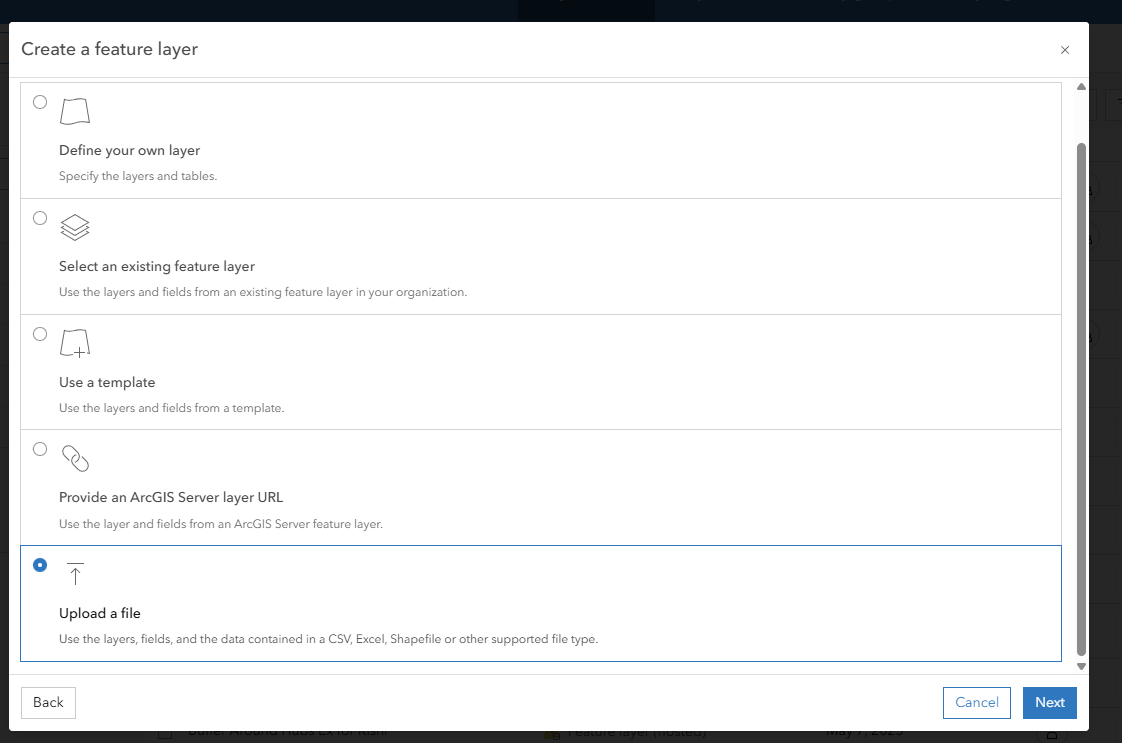
Upload a file
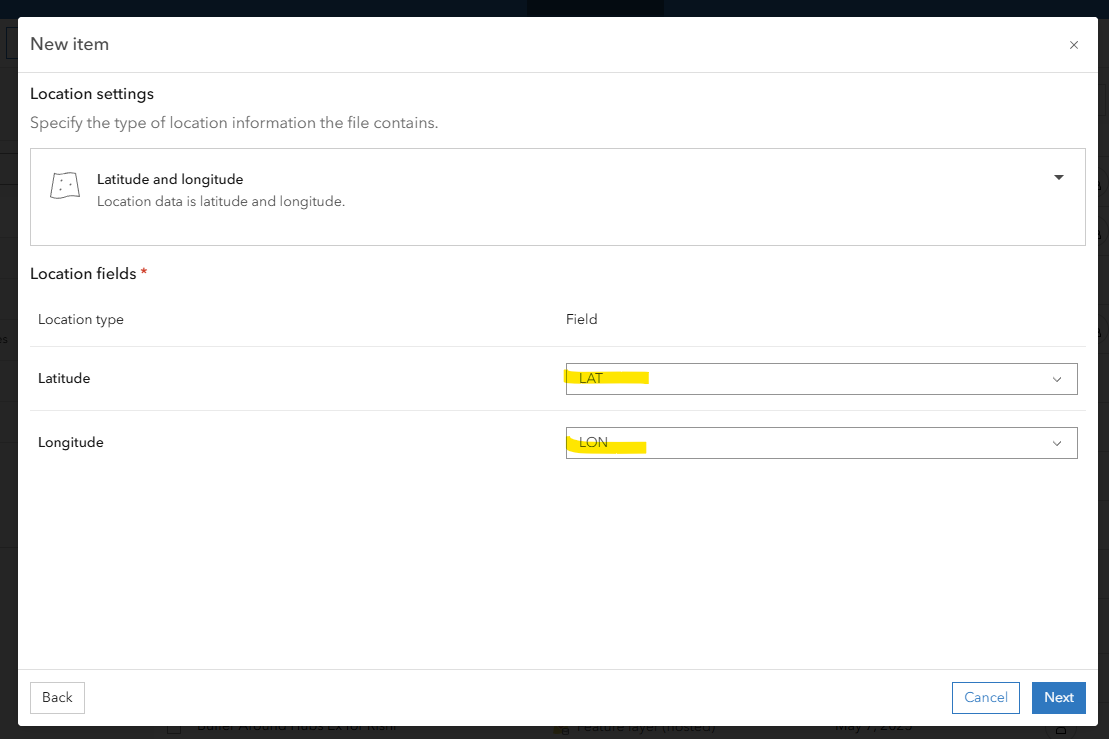
Identify Latitute and Longitude data
Global Average Wind Speeds by Month and Altitude
https://www.arcgis.com/home/item.html?id=3de721e9c4d84e72ac65c761f7d47668

Adding Data using Addresses

Joining Data
Add hospital Data
https://ricegis.maps.arcgis.com/home/item.html?id=77087d6c494141b4929418a765a00505
Labels
Charts
Hospital Beds
Aggregate Points Tool
https://doc.arcgis.com/en/arcgis-online/analyze/aggregate-points-mv.htm
- Add Hospital Data
- Explore the Data
- State Map. Too
- ICU by Population
- Discuss Other Join Options
- Join Features
- Spatial Joins
- Attribute Joins
- Join Features
Popups and Charts
- Clean Popups
- Chart on Popups
- Labels on Points, Set visibility of labels
- Discuss publishing
Goals:
- Navigate AGOL
- Create a Web Map
- Add and manage data on a webmap
- Customize Symbology to illustrate a geospatial problem
- If Time, adding a chart to the map, add charts to popups
- If Time, upload a
Intro:
- New Material
- Example Map
- Breakout Rooms Map
Temp Outline
- How to navigate ArcGIS Online
- Menus, apps, content, settings
- How to Add a Sketch Layer
- How to Add Data
- Change Order of Layers
- Create a Layer Group
- How to configure Popups
- Adding Data (requires Publisher?)
- Add a SS
- Add a Media Layer
- Sharing Your Map
FUTURE: Creating a Layer with Lat/Long, Creating a Layer with Georeferencings (After upgrading everyone to publisher)
Future: Explaining Point, Line, Polygon. Vecter/Raster/Image
Future: Popups and Charts
Navigating a Layer Data
Layers:
"ACS Vehicle Availability" ESRI
COH METRO BUS STOPS
Houston Census Tract Demographics
Houston Freeways
Operations:
Summarize Within